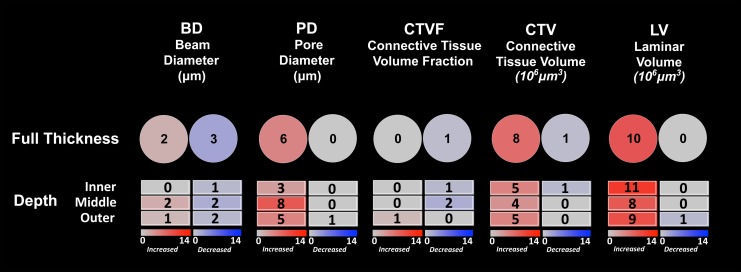
Figure 6.
Frequency and direction of animal-specific LMA parameter change by depth. (Upper Row) The total number of animals demonstrating EG versus control eye increases (red) and decreases (blue) exceeding the PIPDmax (Supplementary Table S1) for each parameter are reported. (Lower Three Rows) Similar data for the inner, middle, and outer LC layers are reported. PIPDmax values for each parameter by LC depth are reported in Supplementary Tables S2–S4.

