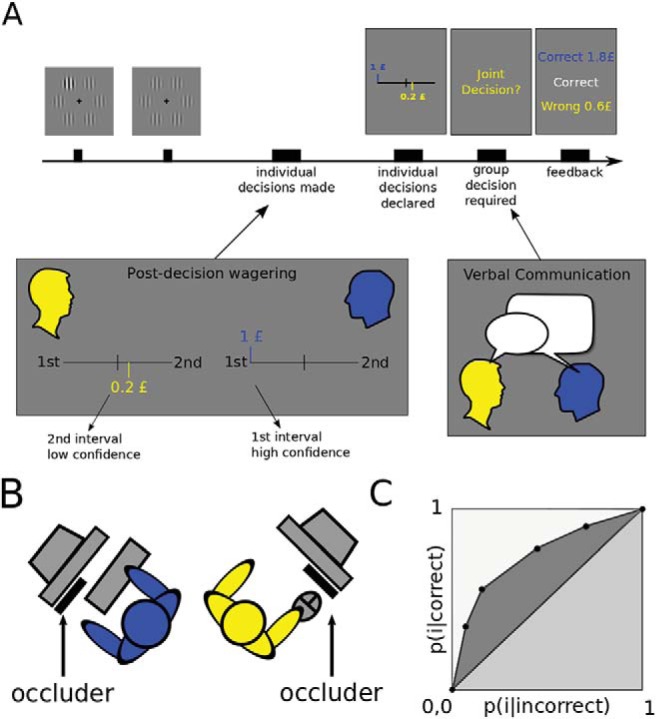
Figure 1.

Experimental paradigm. (A) After stimuli were presented on each trial, participants were asked to respond individually through postdecision wagering (PDW) and were not allowed to talk (Postdecision wagering panel). Each participant could wager up to one pound on one of two possible intervals. Then, personal decisions were declared and a joint decision was required. Participants could wager together up to one pound on the group’s choice and were now allowed to verbally communicate (Verbal communication panel). Finally, feedback on performance and relative earnings were given. (B) Experimental set up: one participant used keyboard response mode and the other mouse response mode. They swapped position and device half way through the experiment. (C) Typical ROC curve constructed from 5-points confidence scale (fictional data). x axis: probability of expressing confidence i after incorrect decisions. y axis: probability of expressing confidence i after correct decisions. The area under the curve (AROC = dark gray + light gray area) represents metacognitive sensitivity. See the online article for the color version of this figure.
