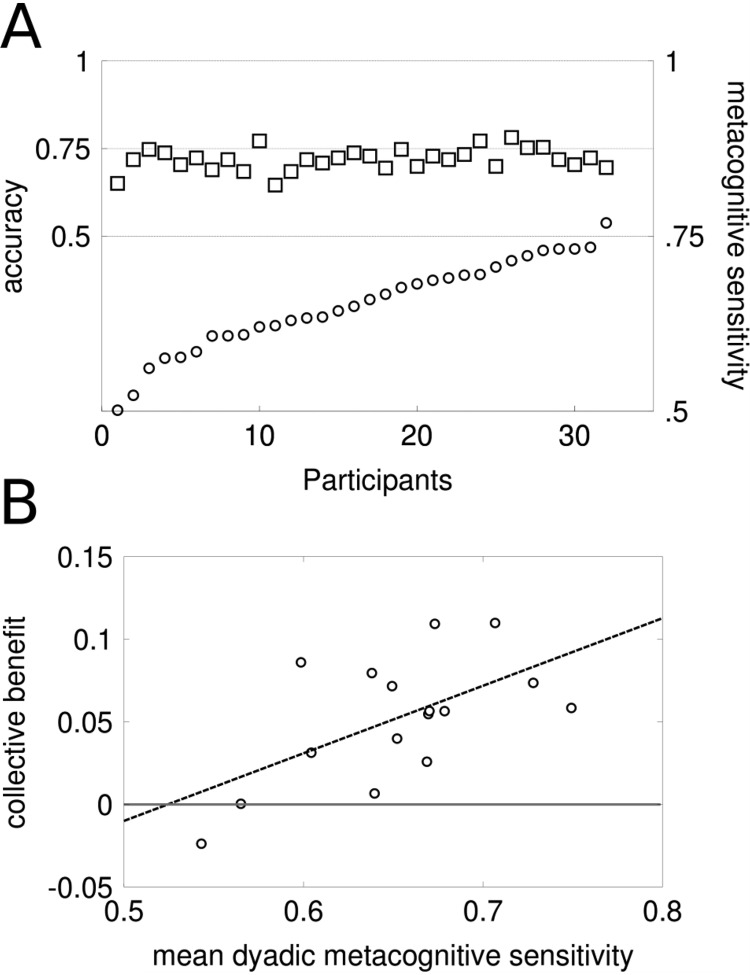
Figure 6.
(A) Individual AROC (circles) and accuracy (squares) values are plotted for each subject. Manipulation of performance with staircase method made different individuals converge around 71% of accuracy. Metacognitive sensitivity was not affected as can be seen by the wide range of AROC values. The same plot but arranged by dyads is shown in Figure S9A. (B) Correlation between mean dyadic metacognitive sensitivity (computed as AROC) and achieved collective benefit (difference between dyadic accuracy and average participants’ accuracy), r(14) = 0.59; p = .01. The black solid line indicates the boundary of collective benefit and collective loss. Points above the line indicate dyads reaching collective benefit. Points below the line indicate collective loss.

