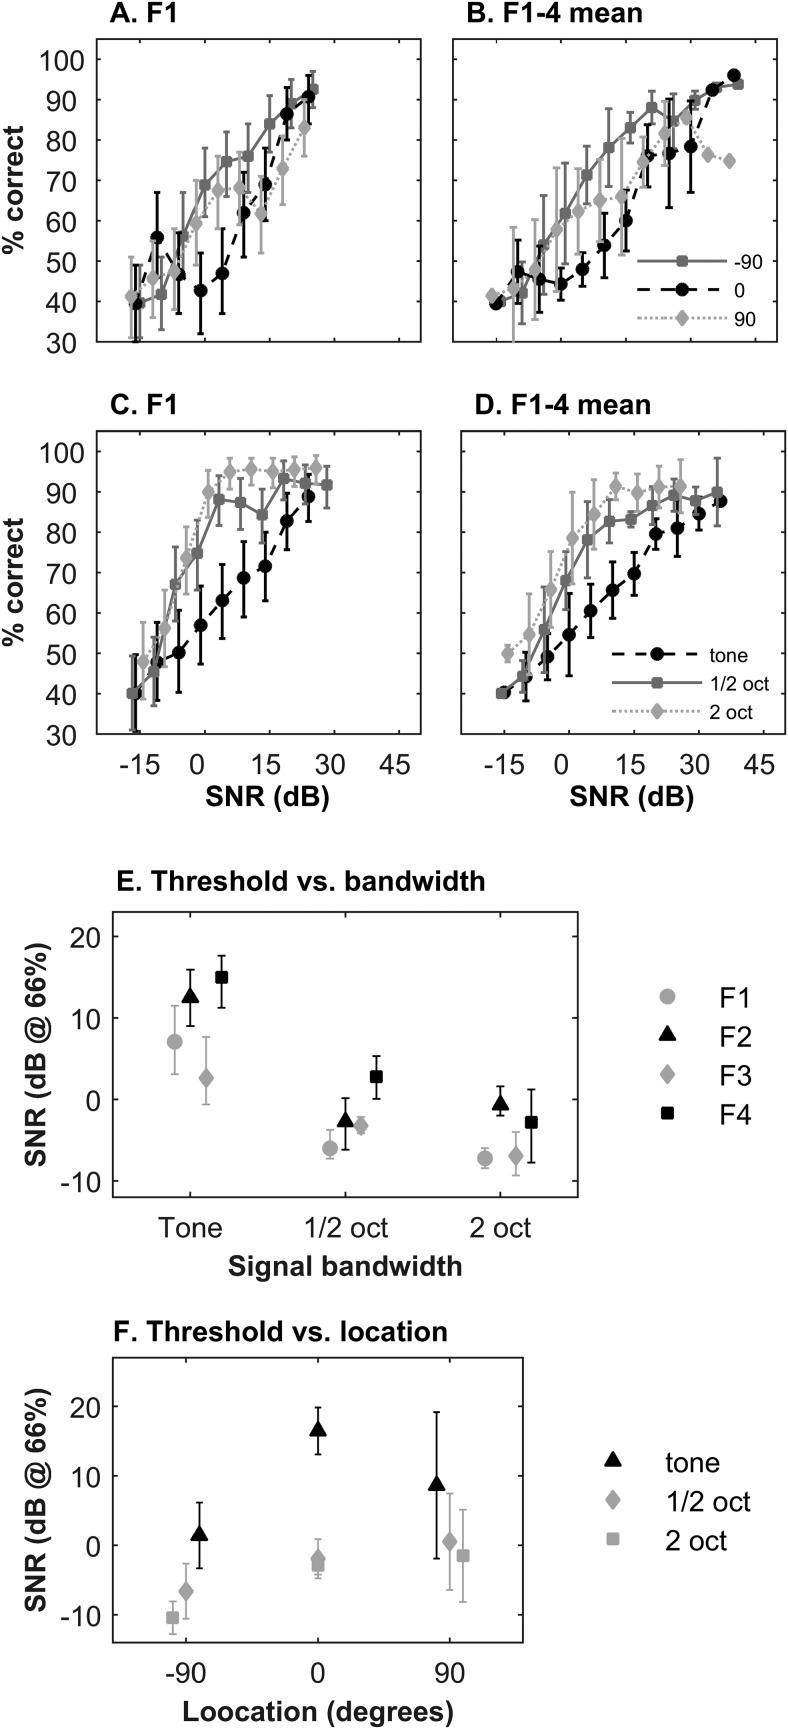
Figure 3.
Three-location discrimination in background noise. (A) Performance as a function of signal-to-noise ratio (SNR) for each location of a 10-kHz pure tone target, for F1 only. (B) Average performance for F1–4 as a function of SNR for each location of 10-kHz pure tone. (C) Mean performance averaged across signal location, for F1 only, as a function of SNR and signal bandwidth. (D) Mean performance for F1–4, averaged across all signal locations, as a function of signal bandwidth. (E) Localization thresholds (66%) for each signal bandwidth. (F) Localization thresholds as a function of source location. Error bars in Parts A, C, and E indicate 95% confidence intervals. Error bars in Parts B, D, and F show standard deviation across animals. Note that in Part B, the two largest SNRs were only tested in one animal.

