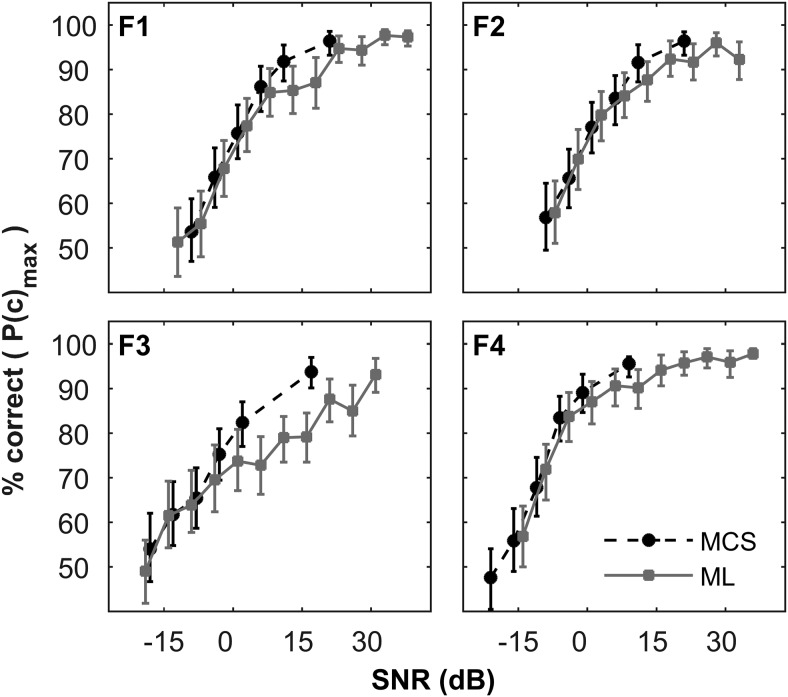
Figure 4.
Two-location (left/right) discrimination performance for 10-kHz pure tones in noise as a function of signal-to-noise ratio (SNR) for F1–4, individually. Lines show psychometric functions collected using the method of constant stimuli (MCS) and method of limits (ML; SNR offset slightly for clarity). Error bars indicate 95% confidence intervals.

