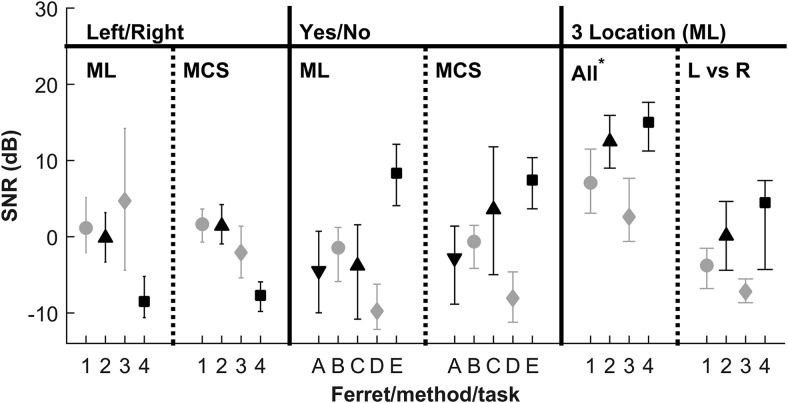
Figure 5.
Comparison of individual two-location (left/right) discrimination, detection (yes/no) thresholds, signal-to-noise ratio (SNR) at 75% P(c)max, and three-location discrimination in noise. Error bars show 95% confidence intervals. * Three-location thresholds averaged across all locations are drawn from raw % correct scores at 75%. Other data points are thresholds calculated from PCmax.

