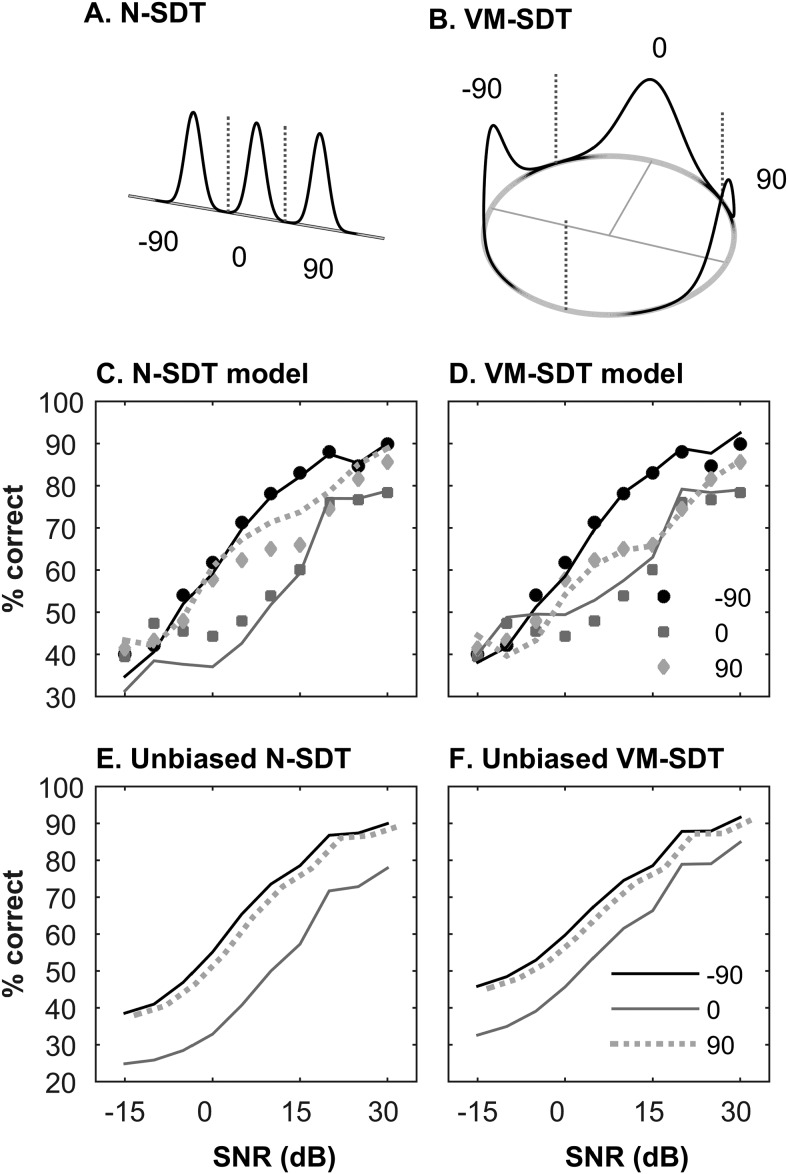
Figure 6.
Signal-detection models of Experiment 3. (A) The internal representation for a normal signal detection theory (N-SDT) model with a linear spatial dimension, normally distributed representations of source location and putative ideal discrimination criterion locations. (B) The internal representation of the von Mises signal detection model (VM-SDT) showing a circular spatial dimension, example distributions associated with the three signal locations and ideal criterion locations. (C) The results of fitting the N-SDT model (solid lines) to the data (points) in Experiment 3, averaged across subjects. (D) The results of fitting the VM-SDT model. (E–F) The N-SDT and VM-SDT model performance when the decision criterion are fixed as optimal and unbiased (90° lines are displaced slightly horizontally for clarity).

