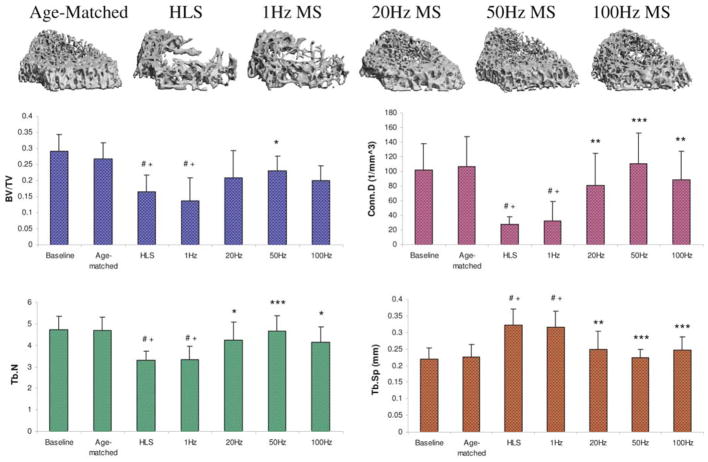
Figure 4.
Representative 3D μCT images of trabecular bone in the M3 region (750 μm, immediately above the growth plate). Graphs show mean + SD values for bone volume fraction (BV/TV, %), connectivity density (Conn.D, 1/mm3), trabecular number (Tb.N, 1/mm), and separation (Tb.Sp, mm) at the M3 region. Only 50 Hz MS demonstrated significant preventive effects for all indices against 4-week HLS. #p<0.001 vs. baseline; +p<0.001 vs. age-matched; *p<0.05 vs. HLS & 1 Hz MS; **p<0.01 vs. HLS & 1 Hz MS; ***p<0.001 vs. HLS & 1 Hz MS. (Courtesy of BONE 2008;43:1093–100).

