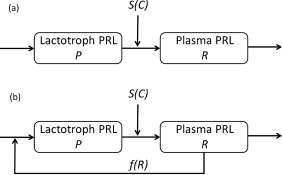
Figure 3.

(a) Schematic representation of the precursor‐pool model for prolactin (PRL) response involving a drug‐intervention through the stimulatory drug effect function S(C) on the elimination of PRL from the lactograph compartment. (b) Schematic representation of the modified pool model for PRL response, involving a positive feedback of the PRL concentration in the plasma compartment on the PRL‐production rate in the lactograph compartment modeled by a nonnegative nondecreasing function f(R).
