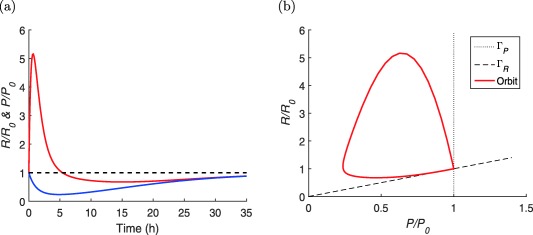
Figure 4.

(a) Graphs of R(t) (red) and P(t) (blue), normalized with respect to their baseline values R 0 and P 0, of the system (Eqs. 15 and 16) for system parameters ks = 26 ng ⋅ mL−1 h−1, and kel = 2.2, h−1 and pharmacokinetic (PK) data Smax = 66 and for D = 3, h−1 ( and ng ⋅ mL−1). (b) The same simulation plotted in the phase plane (MATLAB model code provided in Supplementary Figure S4).
