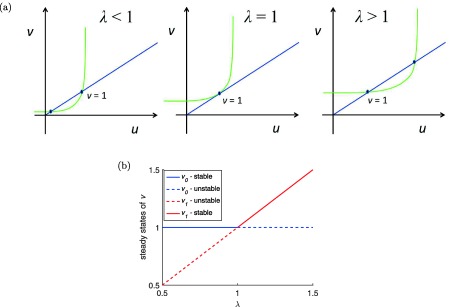
Figure 7.

(a) Changes in the phase‐diagram as a function of the bifurcation ratio . Notice that for (the bifurcation point), the two steady states of v coalesce into just one steady state v = 1. (b) Bifurcation diagram showing the two steady states of plasma prolactin (PRL) concentration v and their stability as a function of the bifurcation parameter (MATLAB model code provided in Supplementary Figure S7).
