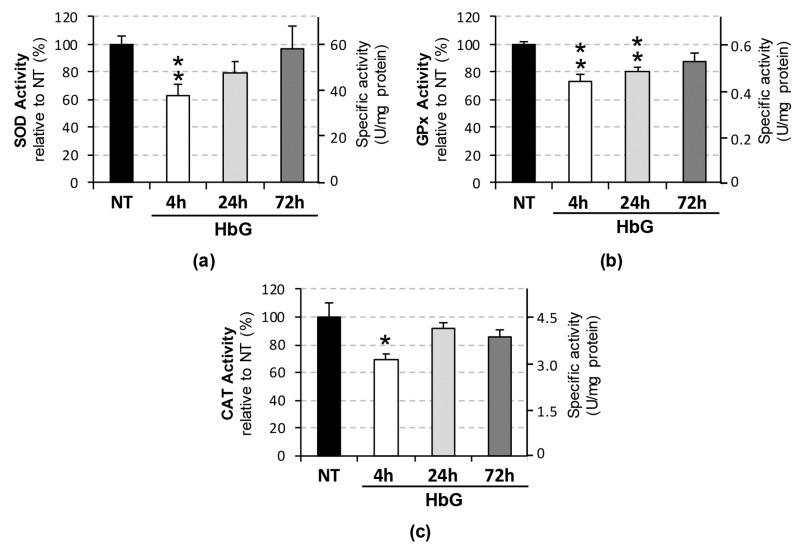
Figure 2.
Renal antioxidant enzyme activities following infusion with HbG. Total SOD (a), GPx (b), and CAT (c) activities were measured at 4, 24, 72 h post-ET with HbG. Data are presented as percentage activities relative to NT (left axis) and estimated specific activities in U/mg protein (right axis). Values are calculated as the means ± SE for replicate experiments (n = 3–5 animals per group). Asterisks indicate significant differences compared to NT (* p < 0.05, ** p < 0.01).

