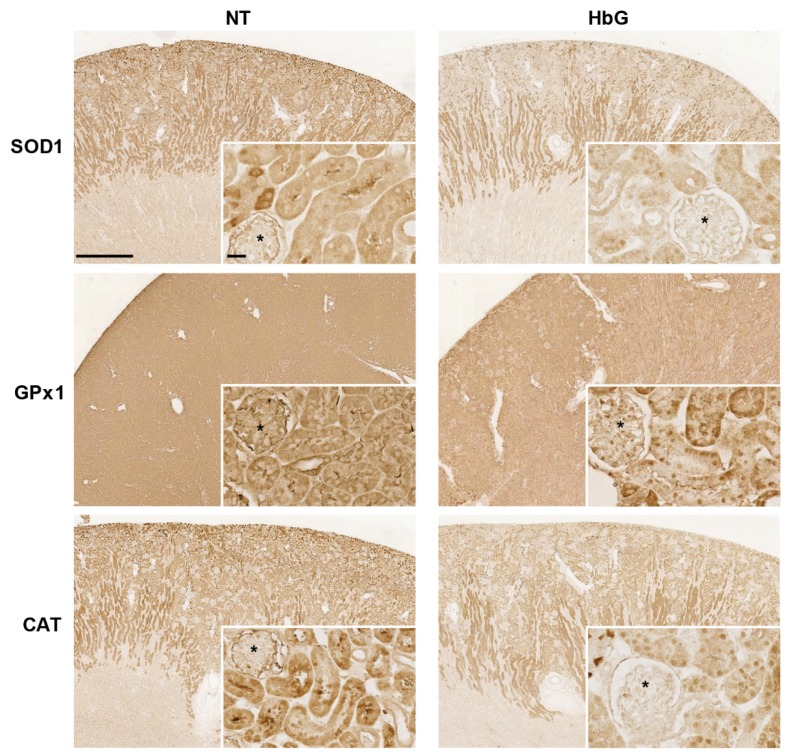
Figure 3.
Immunohistochemical analysis of SOD1, GPx1, and CAT protein expression. Kidney sections from sham controls and 4 h (SOD1 and CAT) or 12 h (GPx1) post-ET with HbG were probed as described in the Materials and Methods. Reduced immunoreactivity (brown signal) was observed for all three enzymes in the HbG group compared to NT. Asterisks denote glomeruli. Scale bars: 1 mm (main panels) or 25 µm (inserts).

