Figure 5.
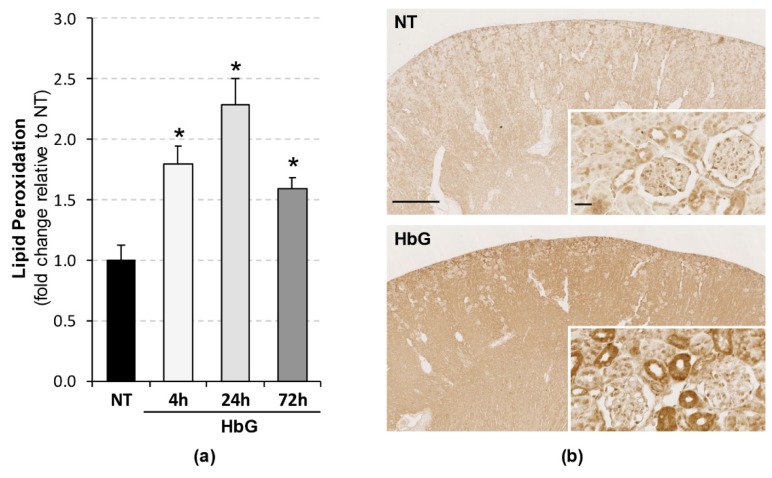
Renal lipid peroxidation following HbG infusion. (a) MDA+HAE levels were analyzed in renal tissue homogenates as described in the Materials and Methods. Results were calculated as pmol/mg protein and presented as the fold change relative to sham controls. Data are shown as the means ± SE for at least four animals per time interval. * p < 0.05 versus NT; (b) 4-HNE immunohistochemistry showing enhanced immunoreactivity (brown signal) in HbG group (4 h post-ET) compared to NT. Scale bars: 1 mm (main panels) or 25 µm (inserts).

