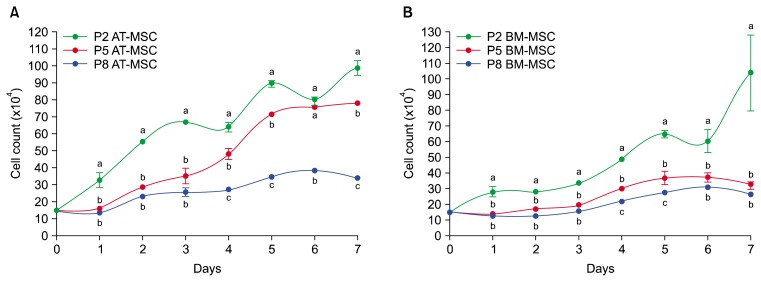
Fig. 4.
Comparison of mean and standard error of cell counts in growth curves of guinea pig bone marrow-derived mesenchymal stem cells (BM-MSCs) and adipose tissue-derived mesenchymal stem cells (AT-MSCs) between passages 2, 5 and 8. The proliferation rate of AT-MSCs (A) and BM-MSCs (B) decreased gradually from passage 2 to passage 8. a,b,cSuperscript letters show differences between the number of cells in each curve in the same day (p<0.05).

