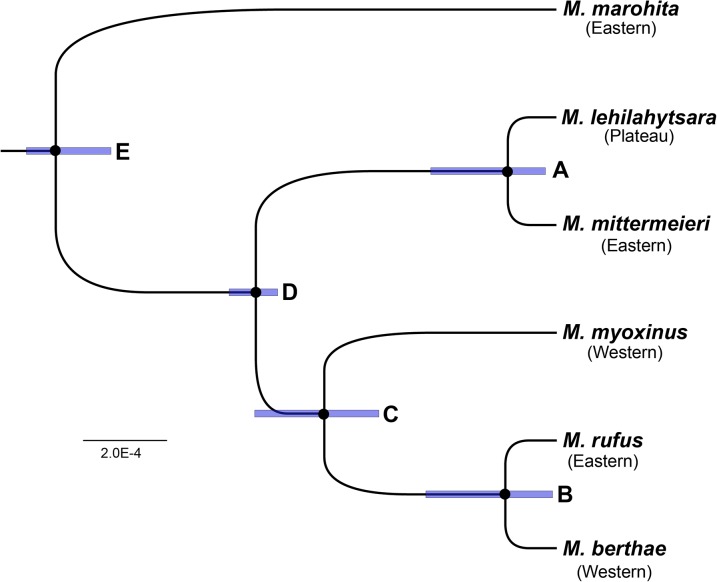
Fig. 3.
Maximum clade credibility species tree from a BPP analysis of nuclear RAD-seq data. Node labels correspond to those in Table 1. All nodes in the tree have 100% statistical support. Blue bars are the 95% highest posterior densities of node heights. Species are identified by their contemporary geographic range (eastern versus western); plateau, Central Highlands plateau.

