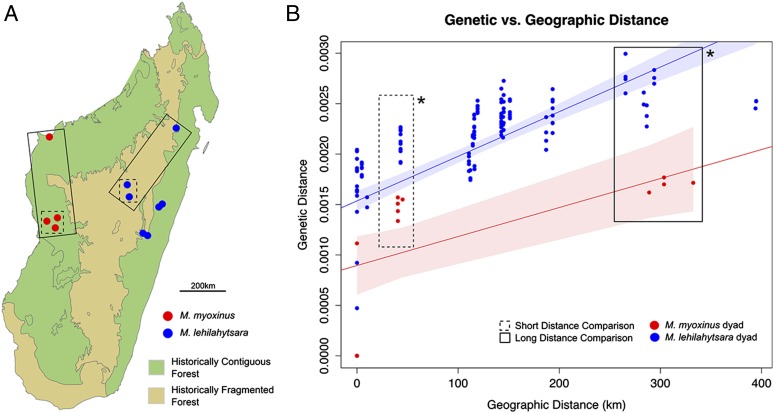
Fig. 5.
(A) A map of Madagascar with sampling locations for two focal species, M. myoxinus and M. lehilahytsara, hypothesized historical forest type labeled by color, and boxes marking the sampling locations used for short and long geographic distance t tests of genetic distance. (B) Plot of genetic distance versus geographic distance in within-species dyads, colored as on the sampling location map. The dashed and solid boxes on both the distance plot and sampling map illustrate the short and long geographic distance comparisons of genetic distance being made. The t tests within each box are significantly significant at the P < 0.01 level (Figs. S1–S3). The line of best fit and shaded 95% confidence interval, plotted with R, are matched to the species by color.

