Fig. 4.
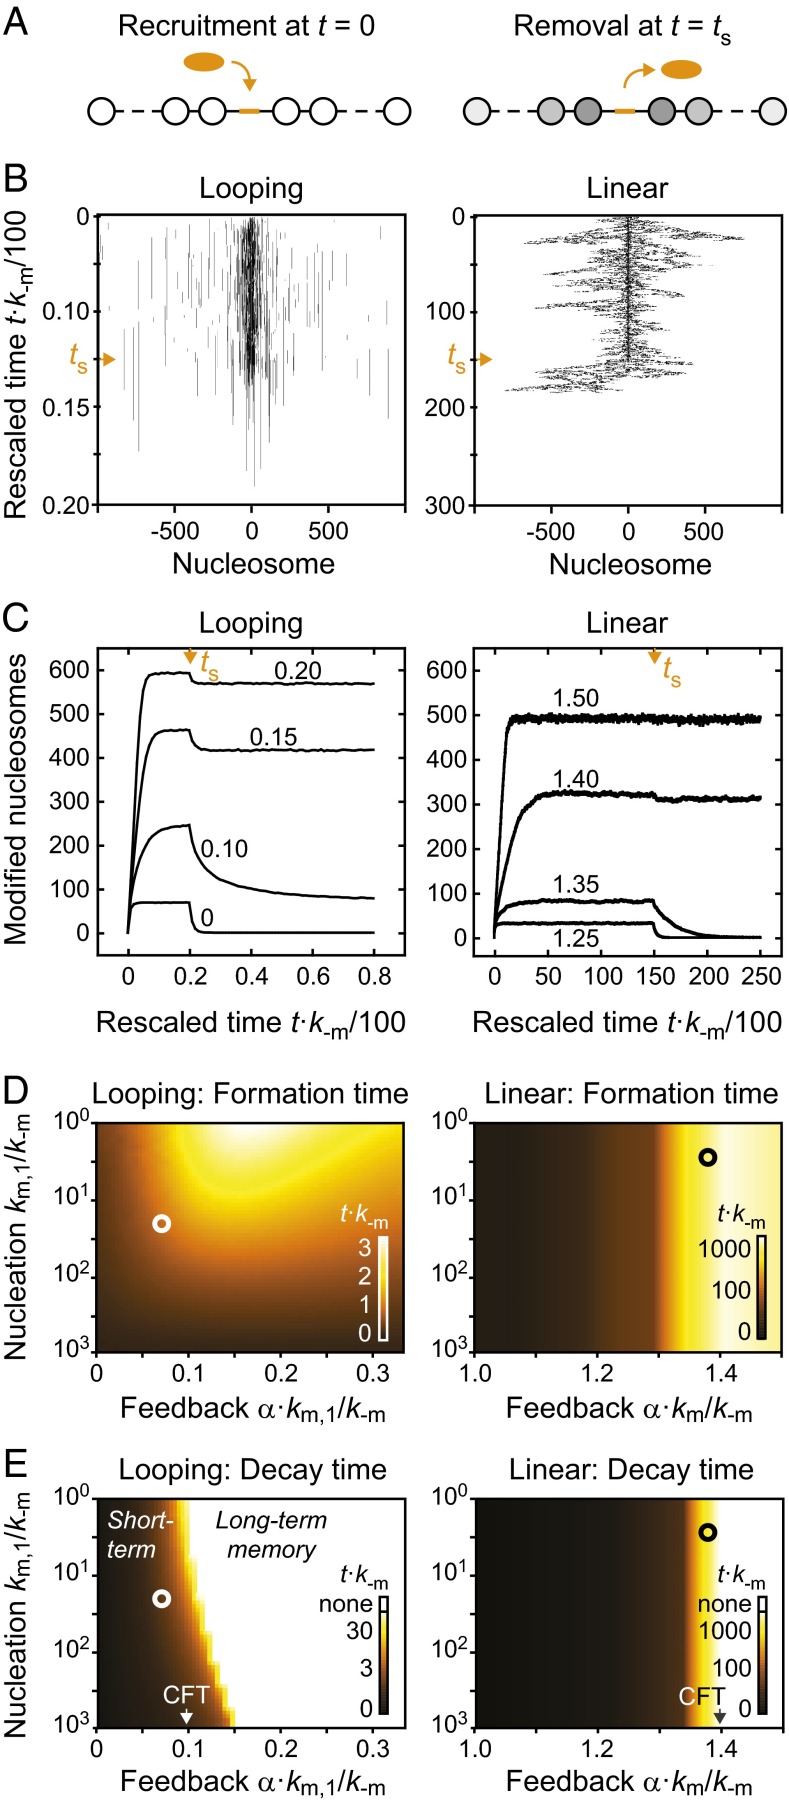
Temporal stability of modification domains. (A) Modification domains were established on recruitment of a modifier to the center of the nucleosomal array. After a steady state had been reached, the modifier was removed. (B) Time evolution for individual simulations of looping-driven (Left) and linear spreading (Right). Vertical axes indicate the elapsed time, which was multiplied with the reverse rate k−m to make the results independent of the actual rate constant. Orange arrowheads reflect the time point at which the modifier was removed. (C) Time evolution of the number of modified nucleosomes within the entire domain for looping-driven (Left) and linear spreading (Right). In both cases, the nucleation strength km/k−m = 20 was used. Orange arrowheads reflect the time point at which the modifier was removed. Numbers within the panels indicate the feedback strength α⋅km/k−m. (D and E) Time required for reaching 50% of the steady-state modification level after the modifier was recruited (D) or removed (E). Calibration bars in the bottom right corners show the assignment between color code and rescaled time t⋅k−m. White circles in the left panels denote nucleation strength km/k−m = 20 and feedback strength α⋅km/k−m = 0.07, which yield domains that have similar properties to those found in WT fission yeast cells (Fig. 5). Black circles in the right panels denote feedback strength α⋅km/k−m = 1.38, which produces a similar number of modified nucleosomes in linear spreading simulations. White regions in E indicate parameter combinations for which domains did not decay below the 50% level.

