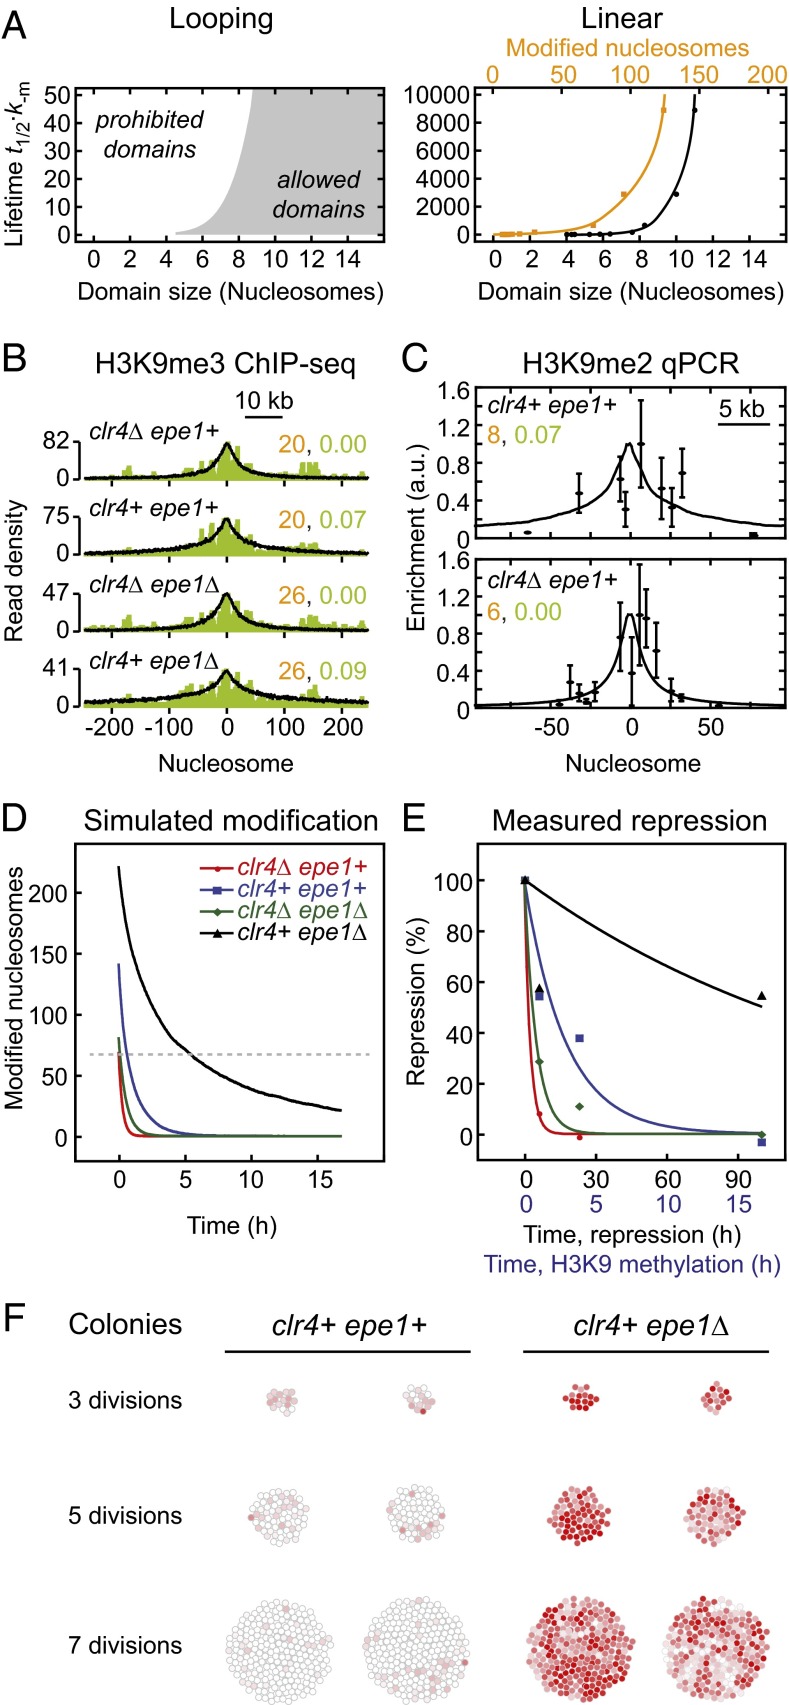
Fig. 5.
Quantitative comparison between simulations and experiments. (A) Relationship between domain size and lifetime for looping-driven (Left) and linear spreading (Right). The domain size reflects the region around the nucleation site that exhibits a modification level above 50%, whereas the number of modified nucleosomes (orange; Right) indicates the total number of modified nucleosomes within the simulated array. (B) Overlay of H3K9me3 ChIP-seq profiles (green, data from ref. 16) with looping-driven spreading simulations. The nucleation and feedback strengths used for the simulations are indicated in orange and green, respectively. (C) Overlay of qPCR measurements (Upper, data from ref. 15; Lower, data from ref. 18) with looping-driven spreading simulations. Parameters from B were adjusted to reflect the reduced number of nucleation sites (10 sites in B, 3/4 sites in clr4Δ/clr4+ cells in C). (D) Simulated decay of engineered domains for the parameters indicated in C. The dashed line indicates the initial modification level for clr4Δ epe1+ cells, which is sufficient for repression. (E) Time evolution of the repression level observed in different fission yeast strains. Points are measurements from ref. 16; lines are monoexponential fit functions. The same color code as in D was used. See Fig. S4B for fit parameters. (F) Simulated colonies originating from a single cell that contained an engineered modification domain. The modifier was released at the first cell division. The color of each cell reflects its modification level (red, modified; white, unmodified).

