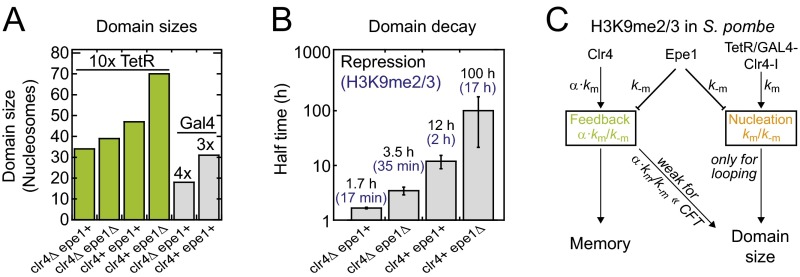
Fig. S4.
Parameters for engineered H3K9 methylation domains in fission yeast. (A) Summary of engineered H3K9me2/3 domain sizes at the ura4 locus in different fission yeast strains. Plotted domain sizes correspond to the full width at half maximum of the simulated profiles in Fig. 5 B and C. According to the simulations, each tetO binding site is associated with a nucleation strength km/k−m = 2, which translates into km/k−m = 20 for the 10× tetO array. The feedback strength in WT cells is α⋅km/k−m = 0.7, and deletion of Epe1 decreases k−m by a factor of 1.3, which increases the nucleation and feedback strength accordingly (see C). (B) Fit results for the decay curves shown in Fig. 5E (black). Error bars correspond to fit errors. Although the precise relationship between the (spatially modulated) modification level and the repression level is unknown, the ratios among repression decay rates can be used as a proxy for ratios among methylation decay rates (blue). The decay rate for the methylation level in clr4+epe1+ cells was taken from ref. 15. To obtain repression levels, the average GFP intensity in ref. 16 was converted into a repression level R according to R = 1 − [I(t) − IOFF]/(ION − IOFF), where IOFF is the average intensity at t = 0 h, which corresponds to the methylated domain in steady state, and ION is the average intensity of the respective clr4Δ cells at t = 100 h, which corresponds to the intensity for the fully activated domain. (C) Simplified model for the regulation of the size and temporal stability of engineered H3K9 methylation domains in fission yeast. Indicated proteins regulate the respective rate.

