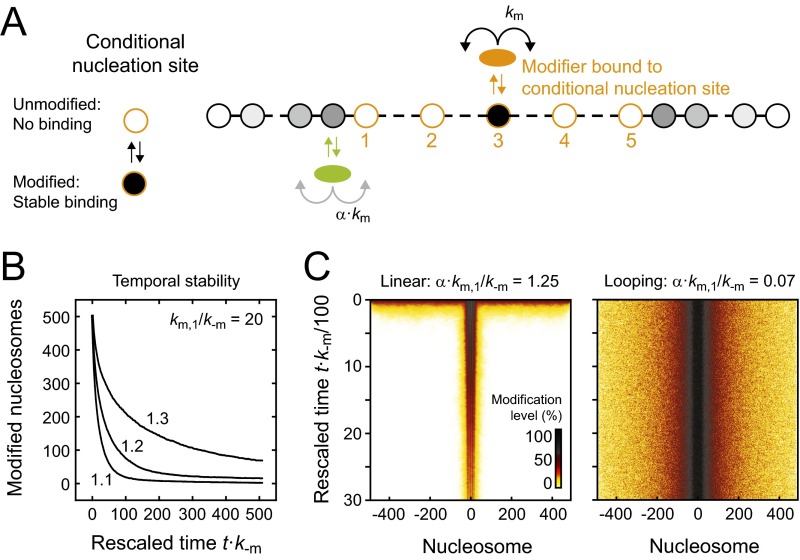
Fig. S7.
Linear spreading around conditional nucleation sites. (A) Linear spreading simulations were conducted in the presence of an array of conditional nucleation sites like in Fig. 6. Conditional nucleation sites were either fully active if modified (km/k−m = 20) or completely inactive if unmodified. (B) Initially, 50% of the nucleosomes within the domain were randomly selected and modified. Subsequently, the simulation was started and the modification level was followed over time. Modification levels decayed for weak and moderate feedback strengths (values in the panel indicate the feedback strength α⋅km/k−m). (C) Average time evolution of the spatial distribution of modified nucleosomes for linear (Left) and looping-driven (Right) spreading with the indicated feedback strength and nucleation strength km/k−m = 20. The modification level is represented by the color code shown in the bottom right corner of the left panel. In the case of linear spreading, only nucleosomes next to the nucleation sites retained a moderate modification level for prolonged time, which eventually decayed completely. In contrast, looping-driven spreading could maintain an extended domain without visible reduction of modification levels.

