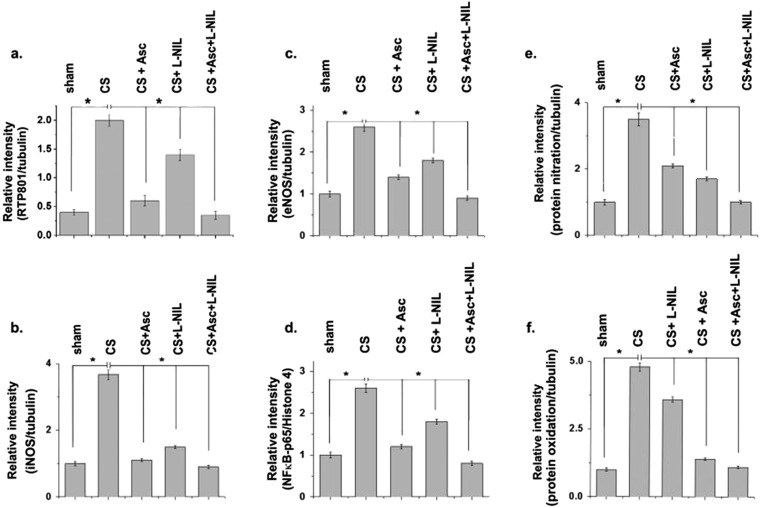
Fig. S4.
Histograms depicting relative levels (intensities) of the proteins Rtp801 (A), iNOS (B), and eNOS (C) in the immunoblots shown in Fig. 4A, normalized against tubulin as internal standard; and NF-κB–p65 (D) normalized against histone 4 as the internal standard. E and F respectively show the relative levels of protein nitration and protein oxidation in Fig. 4 C and E normalized against corresponding tubulin expression. Data were statistically analyzed by paired Student's t test. Significant differences (*P < 0.05) were observed in comparison with unexposed controls. Data are represented as means ± SD and are representative of three independent experiments done under similar conditions.

