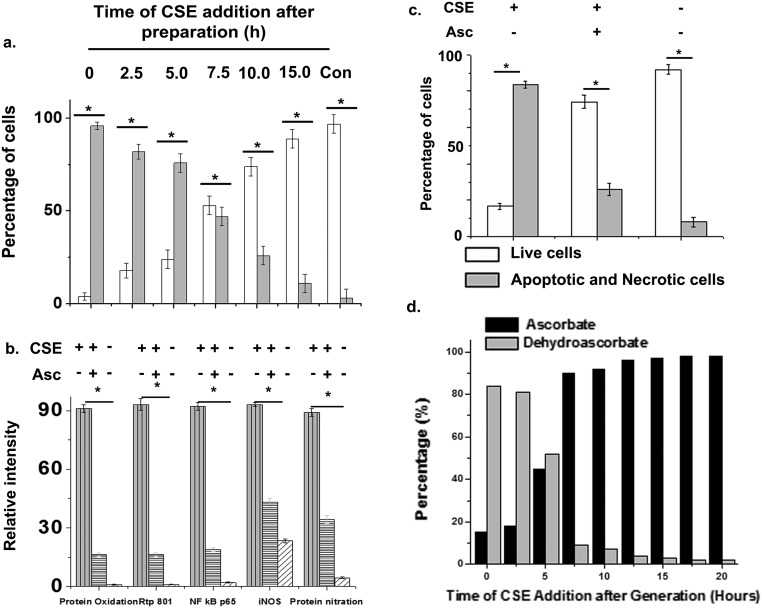
Fig. S6.
Histograms depicting relative numbers of apoptotic and necrotic human epithelial lung cells shown in Fig. 6C after time-dependent addition of freshly prepared CSE (A) and shown in Fig. 6E with and without Asc addition during CSE-treatment (C). B shows the relative levels (intensities) of protein oxidation, Rtp801, iNOS, and protein nitration normalized against tubulin along with NF-κB normalized against histone 4 as internal standards, in the immunoblots shown in Fig. 6D. D represents relative levels of conversion of ascorbate to dehydroascorbate in the media containing fixed concentration of vitamin C (200 µM) and exposed to CSE at different time points after its preparation. Data were statistically analyzed by paired Student's t test. Significant differences (*P < 0.05) were observed in comparison with unexposed controls. Data are represented as means ± SD and are representative of three independent experiments done under similar conditions.

