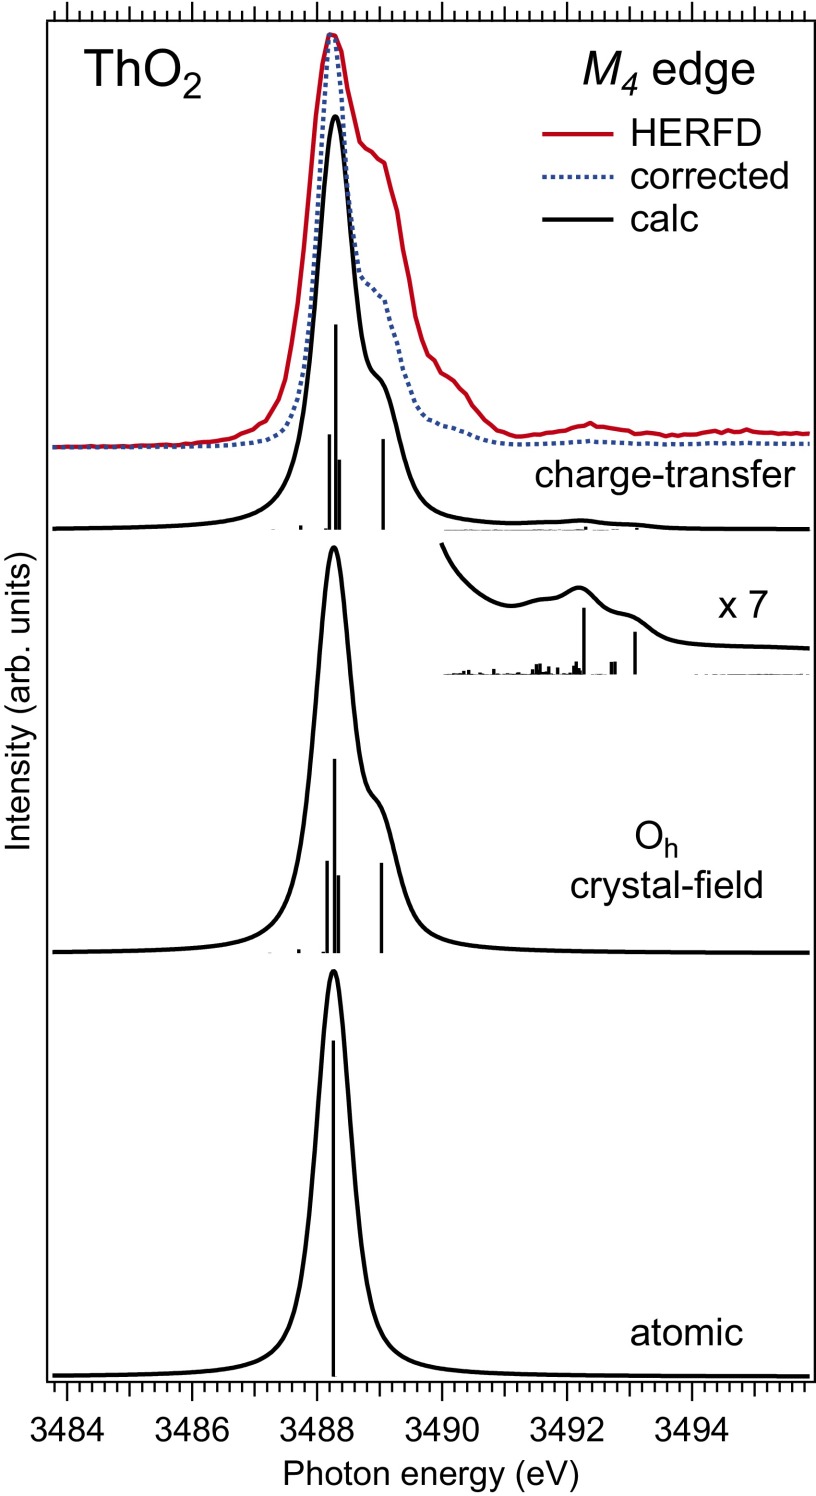
Fig. 4.
Experimental and calculated XAS spectra at the Th edge of ThO2. The spectra are calculated using atomic and CEF multiplet theory for the Th(IV) ion and the Anderson impurity model, respectively. The dashed curve represents the HERFD-XAS spectrum corrected for self-absorption effects (https://www.cells.es/en/beamlines/bl22-claess/software) and normalized to the maximum of the as-measured spectrum.

