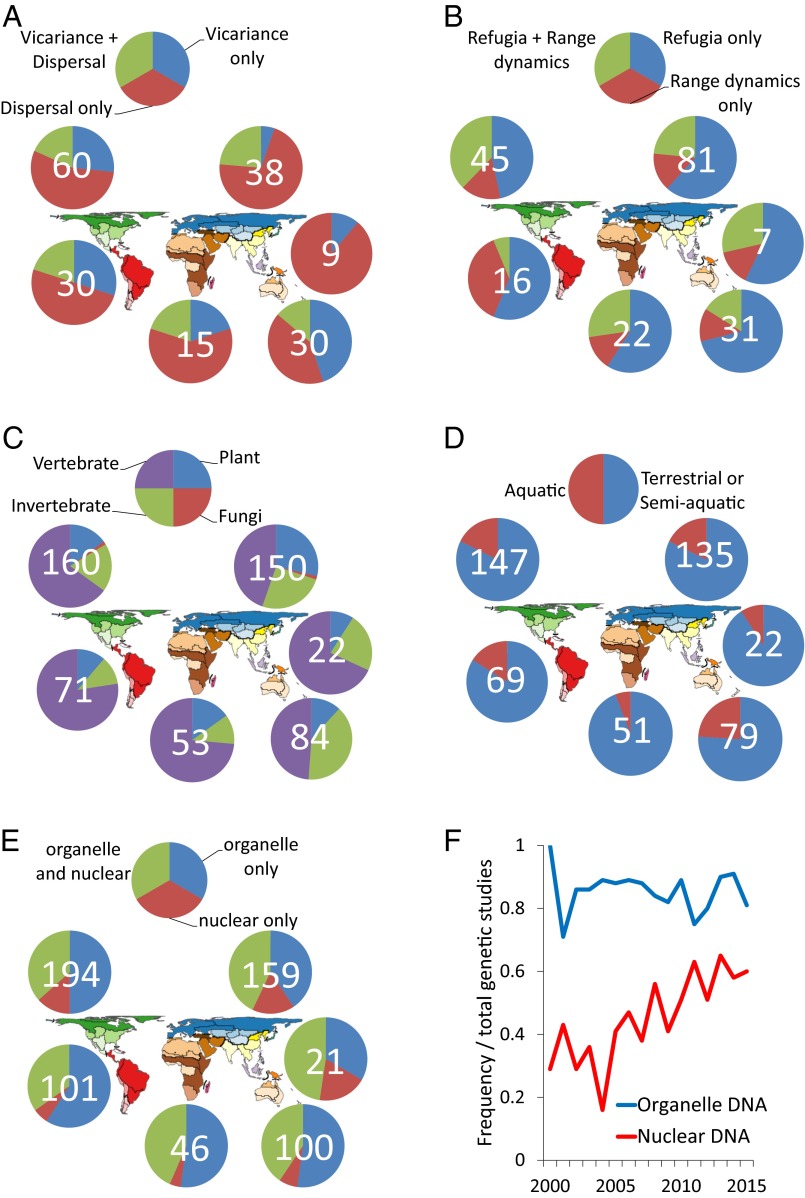
Fig. 6.
(A and B) Categories referenced frequently in continental comparative phylogeography of biotic responses to geological and climatic events (total numbers tallied for each region overlaid on pie charts). Studies divided to contrast terms (A) vicariance only vs. dispersal only vs. vicariance + dispersal, and (B) refugia only vs. range dynamics only vs. refugia + range dynamics. Range dynamics includes references to range expansion, range contraction, and range shift and variants of each. (C and D) Frequencies of organisms, summarized into taxonomic groups and medium inhabited, studied in continental comparative phylogeography according to search of the database used in this study. Taxa contrasted (C) as vertebrate vs. invertebrate vs. plants vs. fungi; and medium (D) contrasted as terrestrial or semiaquatic vs. aquatic organisms. (E and F) Frequencies of genomes used in continental comparative phylogeography studies. Organelle DNA (including mitochondrial DNA and chloroplast DNA, also searched as mtDNA and cpDNA) contrasted (E) with nuclear DNA (including all types of markers) as organelle only vs. nuclear only vs. organelle and nuclear. The frequency of studies (F) using markers from each genome plotted through time (numbers for 2015 not complete because database was downloaded from Web of Science in December 2015). Map modified with permission from ref. 4.

