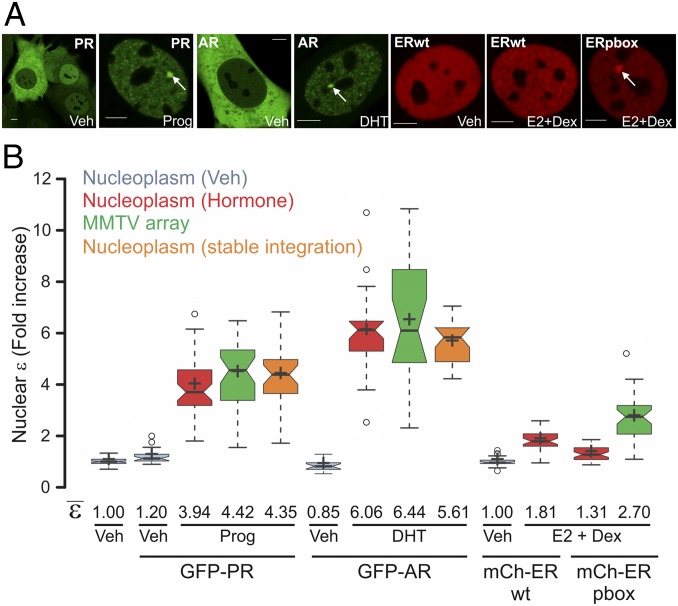
Fig. 2.
PR, AR, and ER oligomeric state in living cells. (A) Subcellular localization of 3617 cells transiently expressing GFP-PRB or GFP-AR. For ER visualization, 7438 and 6644 cells were chosen that express mCherry-ERwt or the pbox mutation, respectively, under the Tet-off system. Cells were treated with progesterone (Prog), dihydrotestosterone (DHT), or estradiol (E2) in combination with Dex to assist the loading of ER (23). White arrows point to the MMTV array. (Scale bars: 5 μm.) (B) N&B assay. The figure shows the fold increase of the nuclear ε relative to the control. For PR and AR, stable cell lines derived from 7110 cells expressing GFP-PRB or GFP-AR were also measured (orange plots). Center lines show the medians; box limits indicate the 25th and 75th percentiles as determined by R software; whiskers extend 1.5-fold the interquartile range from the 25th and 75th percentiles, with outliers represented by dots; and crosses represent sample means (n = 70, 27, 46, 39, 31, 31, 41, 47, 41, 16, 30, 22, and 29 cells).

