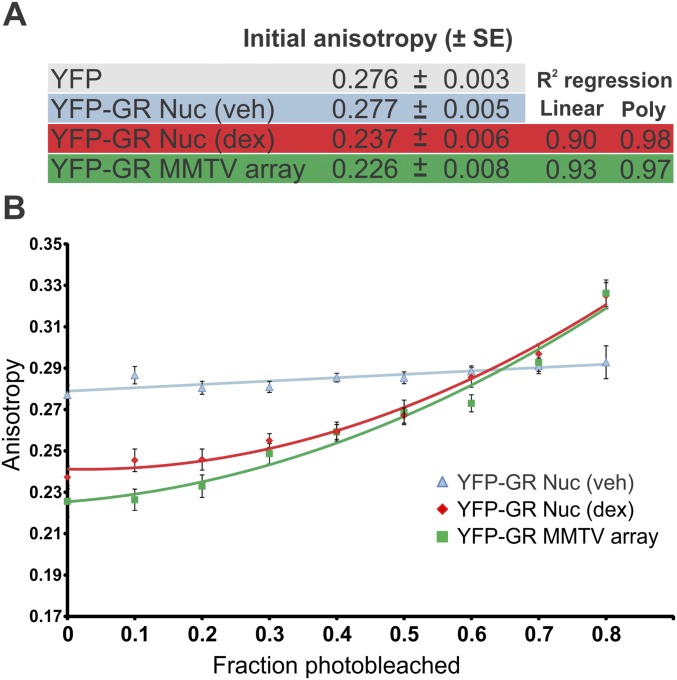
Fig. S2.
Homo-FRET measurements reveal higher GR oligomerization in both the nucleus and the MMTV array. (A) Initial steady-state anisotropy values ± SE for the indicated treatments are shown (n = 40 cells). Poly, polynomial. (B) Same cells as in A were sequentially photobleached, and their anisotropy values were measured. Trend lines were fitted to a polynomial or linear regression model (R2 values are indicated in A).

