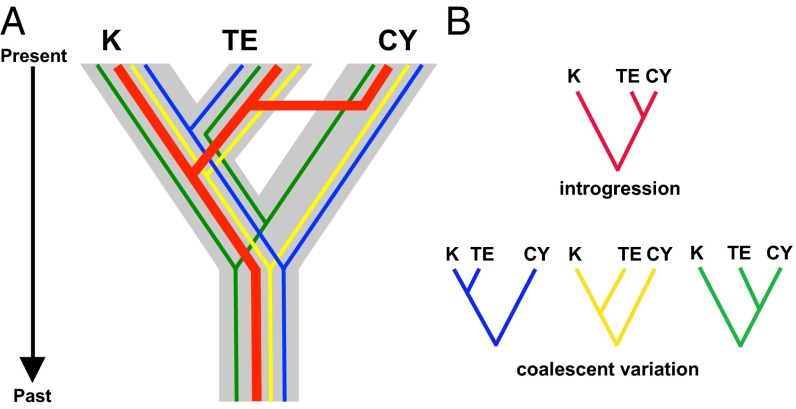
Fig. 2.
Sources of gene tree heterogeneity among diverging lineages. The three lineages KIM (K), TE, and CY are representative of northern Australia populations (Fig. 3). (A) These lineages are arranged by true evolutionary relationships depicted in gray: the “species” coalescent. (B) Within the species tree are gene trees colored in blue, yellow, red, and green. These gene trees represent independent coalescent histories and highlight various sources of gene tree discordance. Blue, green, and yellow gene trees highlight variation due to differing mutation rates and stochastic coalescent histories (including ILS), and red depicts effects of introgression among nonsister lineages. The MSC model allows for estimation of species trees, given mutational and coalescent variance. However, introgression, if extensive, can yield an incorrect species tree (e.g., [K, (TE,CY)] in this case) using most available methods. Additionally, distinguishing introgression from ILS in gene trees can be challenging and mostly relies on branch lengths in gene trees (as in IM models).

