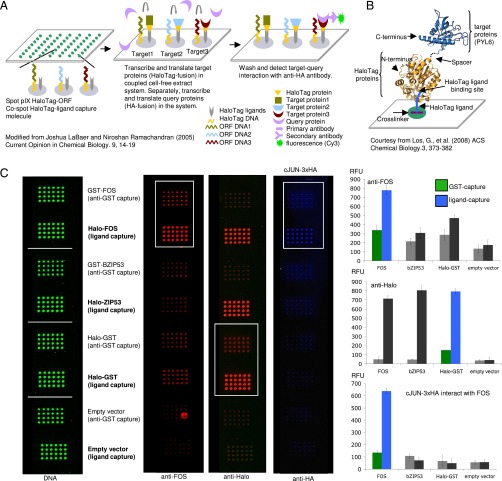
Fig. 1.
(A) The NAPPA assay. Plasmid DNA, cross-linker, and HaloTag ligand are spotted on glass slides. Addition of coupled transcription–translation reagent results in protein expression and localized protein capture. Coexpression of an epitope-tagged query protein enables detection of protein interactions by immunodetection. Modified from ref. 63. (B) Schematic of the HaloTag protein interacting with its chloroalkane ligand. Courtesy of ref. 18. (C) HaloTag gives higher yields of active protein compared with GST-antibody. (C, Left) Amount of deposited plasmid DNA as measured with PicoGreen. (C, Middle) FOS protein as detected by an anti-FOS antibody, Halo-tagged proteins detected by an anti-Halo antibody, and protein interaction between FOS and 3×HA-JUN as detected by an anti-HA antibody (from left to right). (C, Right) Signal quantification of arrays is shown. The y axis represents relative fluorescence units (RFUs). Colored histogram bars indicate signals corresponding to boxed regions on the arrays. Error bars represent SE of the signal intensity.

