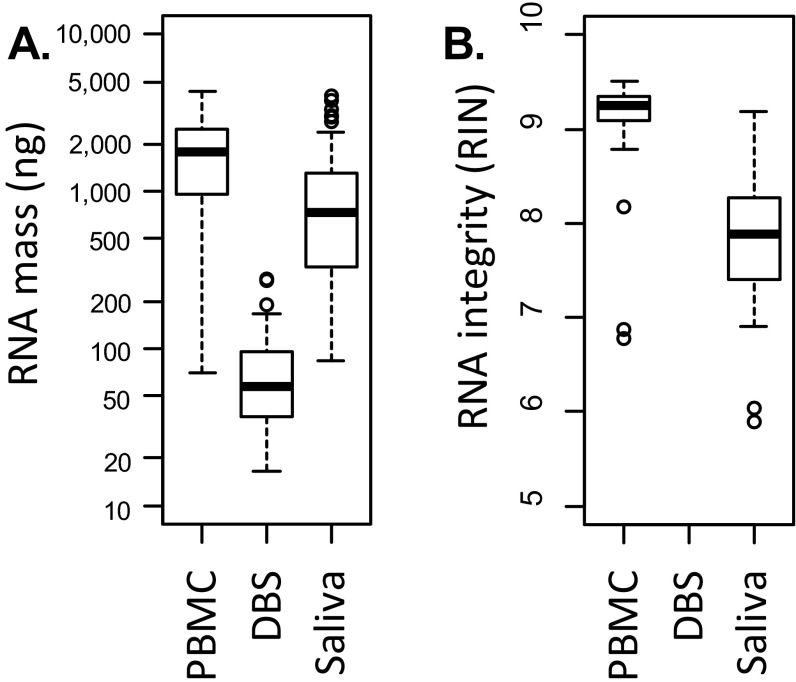
Fig. S2.
RNA mass and integrity in the DBS calibration study. Total RNA mass (A) and RNA integrity (B) were assessed in PBMC, DBS, and saliva samples collected in parallel from n = 58 community dwelling adults. Compared with the PBMC gold standard, DBSs yielded significantly lower quantities of RNA (mean = 1,792 ng for PBMCs vs. 75 ng for DBSs; difference P < 0.0001 by Wilcoxon test). Saliva yielded total RNA mass on the same order of magnitude as PBMCs (mean = 1,029 ng), but with greater levels of degradation (mean RIN score = 9.1 for PBMCs vs. 7.9 for saliva, difference P < 0.0001 by Wilcoxon test). RIN scores range from 0 (fully degraded) to 10 (fully intact) and are unavailable for DBSs (B) because sample RNA mass fell below the limit required for valid assay.

