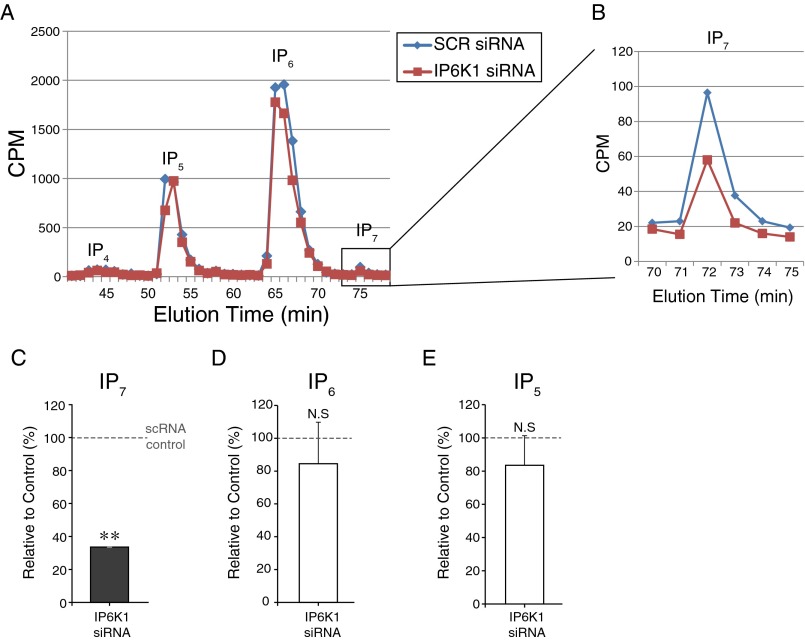
Fig. S3.
Analysis of IP6K1 depletion and intracellular IP7 levels in PC12 cells. (A and B) HPLC analysis was performed as described in SI Materials and Methods. (C–E) Comparison of HPLC analysis of IPs. The decreased IP7 level confirms specific depletion of IP6K1 and its functional consequences in IP7 metabolism (C). Error bars represent SD. **P < 0.01; N.S., nonsignificant (one-sample t test).

