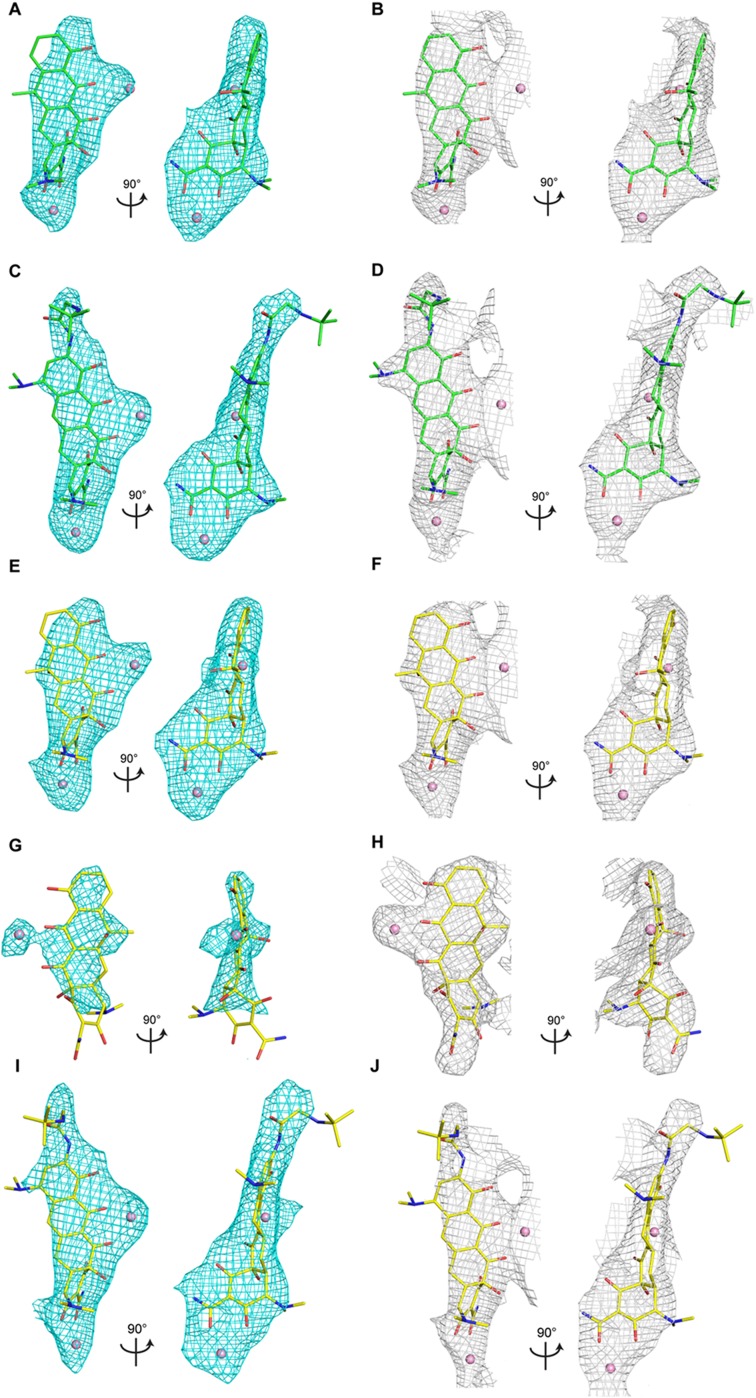
Fig. S2.
Electron density maps. Positive Fo-Fc difference density (cyan; contoured at 3σ) and 2Fo-Fc density (gray; contoured at 1σ) showing bound tetracycline or tigecycline to the wild-type and mutant ribosome. (A and B) Tetracycline bound to the wild-type ribosome. (C and D) Tigecycline bound to the wild-type ribosome. (E and F) Tetracycline bound to the U1052G mutant. (G and H) Tetracycline bound to the novel tetracycline site in the U1052G mutant. The electron density map shown in H is feature-enhanced (3). (I and J) Tigecycline bound to the U1052G mutant.

