Significance
A central issue in the neurobiology of reading is a debate regarding the visual representation of words, particularly in the left midfusiform gyrus (lmFG). Direct neural recordings, electrical brain stimulation, and pre-/postsurgical neuropsychological testing provided strong evidence that the lmFG supports an orthographically specific “visual word form” system that becomes specialized for the representation of orthographic knowledge. Machine learning elucidated the dynamic role lmFG plays with an early processing stage organized by orthographic similarity and a later stage supporting individuation of single words. The results suggest that there is a dynamic shift from gist-level to individuated orthographic representation in the lmFG in service of visual word recognition.
Keywords: fusiform gyrus, word reading, temporal dynamics, intracranial EEG, electrical stimulation
Abstract
The nature of the visual representation for words has been fiercely debated for over 150 y. We used direct brain stimulation, pre- and postsurgical behavioral measures, and intracranial electroencephalography to provide support for, and elaborate upon, the visual word form hypothesis. This hypothesis states that activity in the left midfusiform gyrus (lmFG) reflects visually organized information about words and word parts. In patients with electrodes placed directly in their lmFG, we found that disrupting lmFG activity through stimulation, and later surgical resection in one of the patients, led to impaired perception of whole words and letters. Furthermore, using machine-learning methods to analyze the electrophysiological data from these electrodes, we found that information contained in early lmFG activity was consistent with an orthographic similarity space. Finally, the lmFG contributed to at least two distinguishable stages of word processing, an early stage that reflects gist-level visual representation sensitive to orthographic statistics, and a later stage that reflects more precise representation sufficient for the individuation of orthographic word forms. These results provide strong support for the visual word form hypothesis and demonstrate that across time the lmFG is involved in multiple stages of orthographic representation.
A central debate in understanding how we read, documented at least as far back as Charcot, Dejerine, and Wernicke, has revolved around whether visual representations of words can be found in the brain. Specifically, Charcot and Dejerine posited the existence of a center for the visual memory of words (1), whereas Wernicke firmly rejected that notion, proposing that reading only necessitates representations of visual letters that feed forward into the language system (2). Similarly, the modern debate revolves around whether there is a visual word form system that becomes specialized for the representation of orthographic knowledge (e.g., the visual forms of letter combinations, morphemes, and whole words) (1, 3, 4). One side of the debate is characterized by the view that the brain possesses a visual word form area that is “a major, reproducible site of orthographic knowledge” (5), whereas the other side disavows any need for reading-specific visual specialization, arguing instead for neurons that are “general purpose analyzers of visual forms” (6).
The visual word form hypothesis has attracted great scrutiny because the historical novelty of reading makes it highly unlikely that evolution has created a brain system specialized for reading; this places the analysis of visual word forms in stark contrast to other processes that are thought to have specialized neural systems, such as social, verbal language, or emotional processes, which can be seen in our evolutionary ancestors. Thus, testing the word form hypothesis is critical not only for understanding the neural basis of reading, but also for understanding how the brain organizes information that must be learned through extensive experience and for which we have no evolutionary bias.
Advances in neuroimaging and lesion mapping have focused the modern debate surrounding the visual word form hypothesis on the left midfusiform gyrus (lmFG). This focus reflects widespread agreement that the lmFG region plays a critical role in reading. Supporting evidence includes demonstrations that literacy shapes the functional specialization of the lmFG in children and adults (7–10); the lmFG is affected by orthographic training in adults (11, 12); and damage to the lmFG impairs visual word identification in literate adults (13, 14). However, debate remains about whether the lmFG constitutes a visual word form area (3, 5, 15–18) or not (6, 19, 20); that is, does it support the representation of orthographic knowledge about graphemes, their combinatorial statistics, orthographic similarities between words, and word identity (21), or does it have receptive properties tuned for general purpose visual analysis, with lexical knowledge emerging from the spoken language network (6)?
To test the limits of the modern visual word form hypothesis, we present results from four neurosurgical patients (P1–P4) with electrodes implanted in their lmFG. We acquired pre- and postsurgery neuropsychological data in P1, performed direct cortical stimulation in P1 and P2, and recorded intracranial electroencephalography (iEEG) in all four participants to examine a number of indicators that have been proposed as tests for the visual word form hypothesis by both supporters and opponents of this hypothesis (5, 6). Pattern classification methods from machine learning were then used to measure whether neural coding in this region is sufficient to represent different aspects of orthographic knowledge, including the identity of a printed word. We separately evaluated the time course of lmFG sensitivity to different aspects of orthographic information to assess both early processing, which should exclusively or predominantly capture bottom-up visual processing, and later processing, which likely captures feedback and recurrent interactions with higher-level visual and nonvisual regions. Consequently, we were able to assess the dynamic nature of orthographic representation within the lmFG and thereby provide a novel perspective on the nature of visual word representation in the brain.
Results
Verification of Orthographic Selectivity at lmFG Electrode Sites.
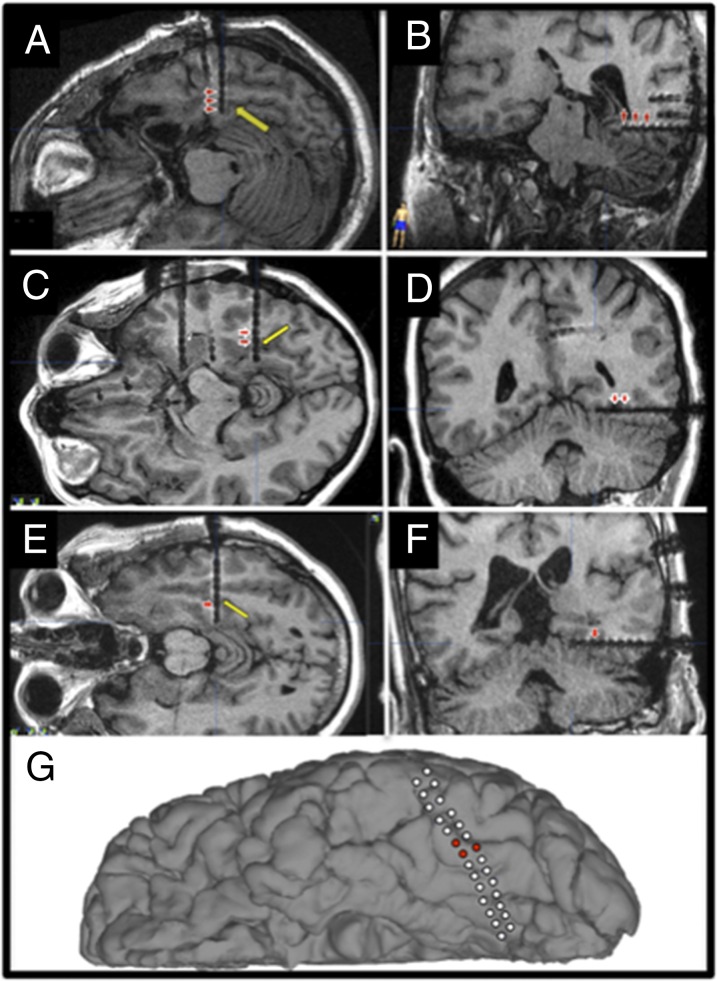
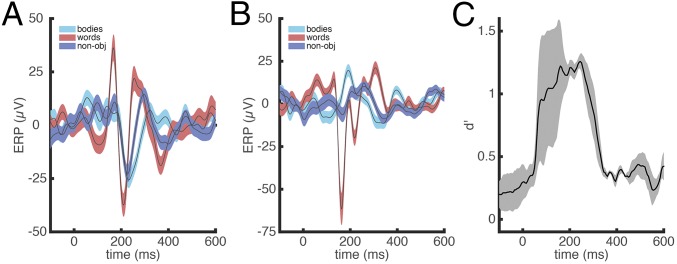
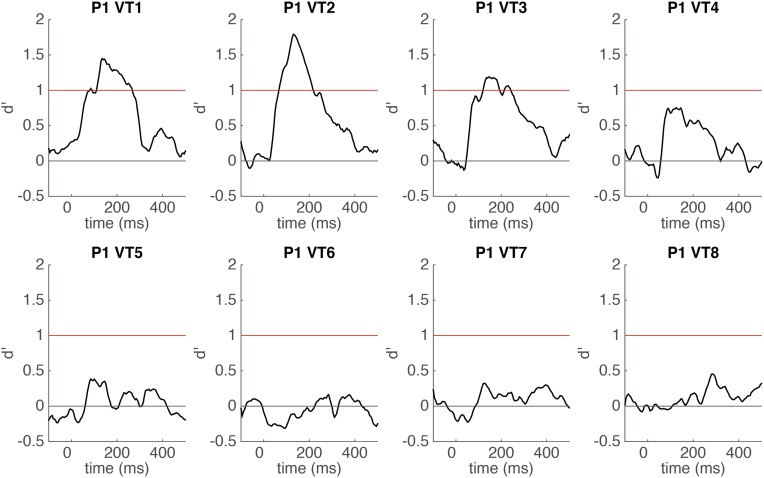
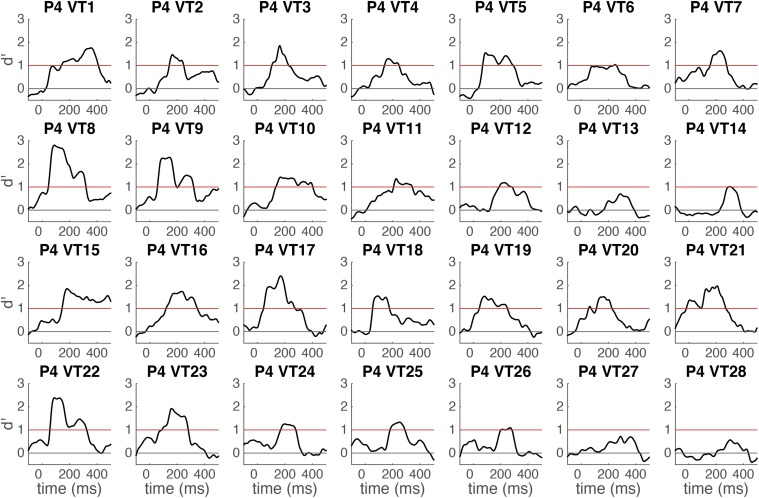
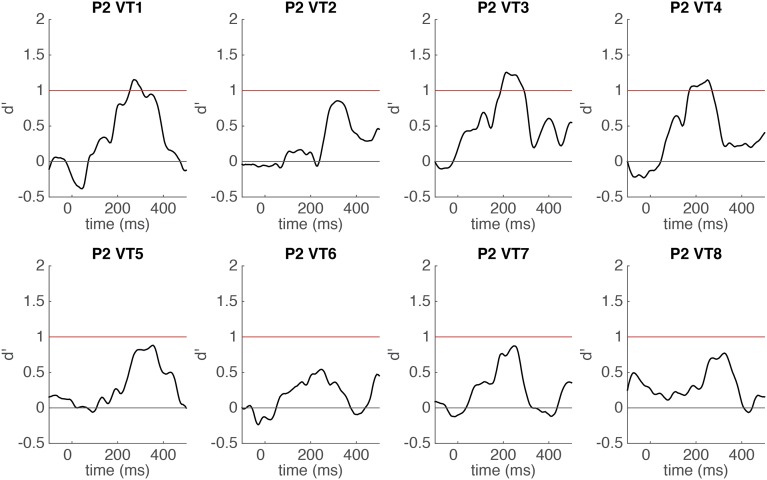
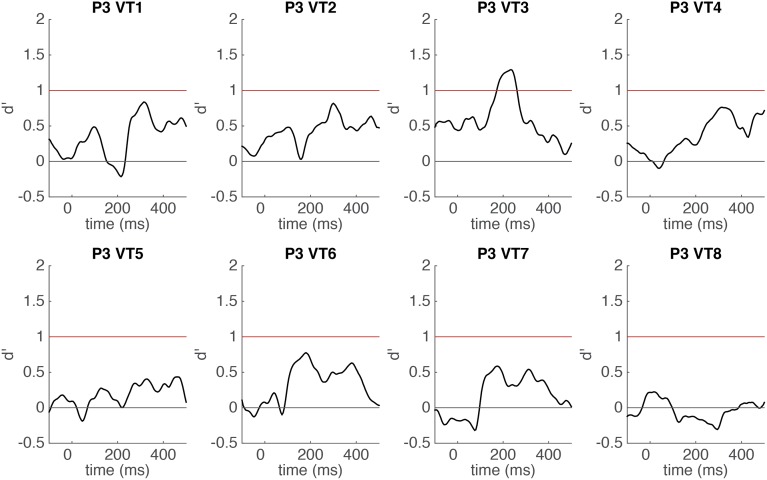
To identify their seizure foci, four patients with medically intractable epilepsy underwent iEEG, which included insertion of multicontact electrodes into or on their ventral temporal cortex (VT) (Fig. 1). To assess the word sensitivity and specificity of lmFG, we used a Gaussian naïve Bayes classifier to decode the neural activity (single trial potentials) while participants viewed three different categories of visual stimuli: words, bodies, and phase-scrambled objects (30 images per category, each repeated once). In each patient in electrode contacts in lmFG, we observed a strong early sensitivity to words at 100–400 ms (Fig. 2 A and B), which was verified using a classifier model (Fig. 2C; averaged peak d′ = 1.26, at 245 ms after stimulus onset, P < 0.001; see Figs. S1–S4 for each individual contact on the electrodes from each participant). The position of the lmFG electrode contacts in the anterior end of the posterior fusiform sulcus is consistent with the putative visual word form area described in the functional neuroimaging literature (22–24). Further, the timing of the category selective response is consistent with evoked potential findings obtained from scalp electrodes (25) and previous iEEG studies (23, 26–28), which have described orthographic-specific effects ∼200 ms after stimulus onset.
Fig. 1.
Location of implanted electrode. Individual electrode contacts are visible on axial (A, C, and E) and coronal (B, D, and F) views and cortical reconstruction (G) of the postimplantation MRI (P1: A and B; P2: C and D; P3: E and F; P4: G). The VT depth electrodes were placed at the anterior end of the midfusiform sulcus in P1–P3 (yellow arrow), and P4 was implanted with a left temporal subdural grid crossing the lmFG. Red arrowheads (A–F) and red filled circles (G) indicate the word-selective contacts identified in the category localizer, which were used in subsequent electrophysiological and/or stimulation experiments. Talairach coordinates (x, y, z) corresponding to the word-selective contacts were located in postoperative MRI structural images, and were all identified in the left fusiform gyrus, BA 37 (P1 electrodes: −31, −36, −13; −35, −37, −13; −39, −38, −12; P2 electrodes: −30, −46, −11; −34, 6, −12; P3 electrodes: −31, −35, −14; P4 electrodes: −38, −51, −21; −41, −50, −22; −41, −54, −20).
Fig. 2.
Verification of orthographic selectivity at lmFG electrode site. (A) Example of averaged ERP across lmFG electrodes in one of the participants (P1) for three different stimulus categories (bodies, words, and nonobjects). The colored areas indicate SEs. (B) Averaged ERP across all lmFG electrodes and across all of the participants for three different stimulus categories (bodies, words, and nonobjects). The colored areas indicate SEs. (C) Time course of word categorical sensitivity in lmFG electrodes measured by sensitivity index d′ (mean d′ plotted against the beginning of the 100-ms sliding window), averaged across three participants. The MTPA classifier uses time-windowed single-trial potential signal from the electrodes from each subject (window length = 100 ms) with each time point in the window from each electrode as multivariate input features (see Methods for details). Across-participant SEs are shaded gray. See Figs. S1–S4 for single-electrode word categorical sensitivity.
Fig. S1.
Time course of word categorical sensitivity in each single electrode of P1 measured by sensitivity index d′ (mean d′ plotted against the beginning of the 100-ms sliding window). The classifier uses time-windowed ERP signal from a single electrode (window length = 100 ms) as input features (see Methods for details). SEs of cross-validations are shaded gray. Horizontal red line indicates significance threshold. Horizontal gray line indicates chance level (d′ = 0). Electrodes 1–3 were the contact of interest for further analysis in P1.
Fig. S4.
Time course of word categorical sensitivity in each single electrode in P4 measured by sensitivity index d′ (mean d′ plotted against the beginning of the 100-ms sliding window). The classifier uses time-windowed ERP signal from a single electrode (window length = 100 ms) as input features (see Methods for details). Horizontal red line indicates significance threshold. Horizontal gray line indicates chance level (d′ = 0). A high-density electrode strip was used in P4. This strip contained two rows of 14 electrode contacts and thus the electrodes of interest, 8, 9, and 22 were next to each other. Other electrodes were either substantially medial to the fusiform (1–5, 15–19) or the classification accuracy was a result of stronger activity for the nonword control stimuli (7, 10–12, 20, 21, 23–25).
Fig. S2.
Time course of word categorical sensitivity in each single electrode of P2 measured by sensitivity index d′ (mean d′ plotted against the beginning of the 100-ms sliding window). The classifier uses time-windowed ERP signal from a single electrode (window length = 100 ms) as input features (see Methods for details). SEs of cross-validations are shaded gray. Horizontal red line indicates significance threshold. Horizontal gray line indicates chance level (d′ = 0). Electrodes 3 and 4 were the contact of interest for further analysis in P2 because electrode 1 was noncontiguous with the other word-sensitive electrodes and medial to the fusiform.
Fig. S3.
Time course of word categorical sensitivity in each single electrode in P3 measured by sensitivity index d′ (mean d′ plotted against the beginning of the 100-ms sliding window). The classifier uses time-windowed ERP signal from a single electrode (window length = 100 ms) as input features (see Methods for details). SEs of cross-validations are shaded gray. Horizontal red line indicates significance threshold. Horizontal gray line indicates chance level (d′ = 0). Electrode 3 was the contact of interest for further analysis in P3.
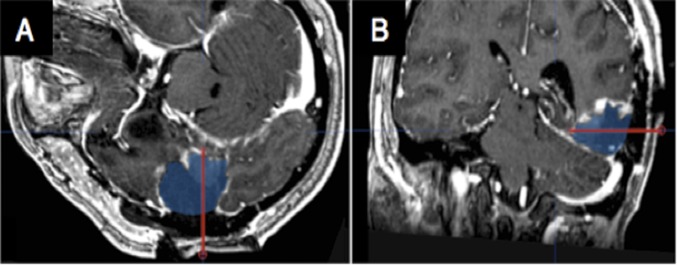
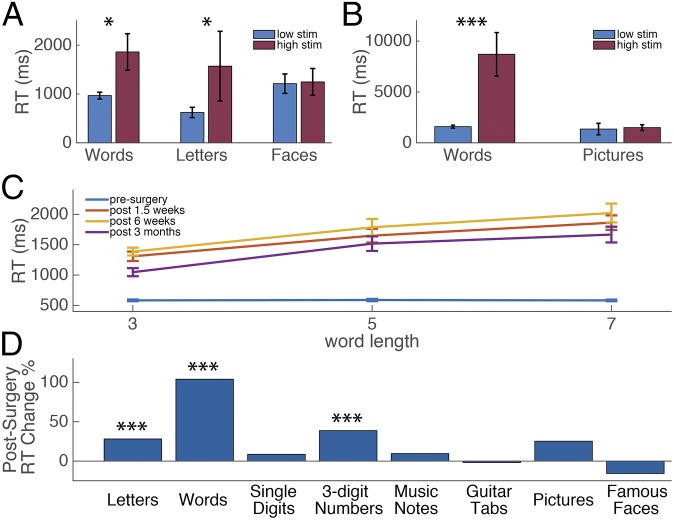
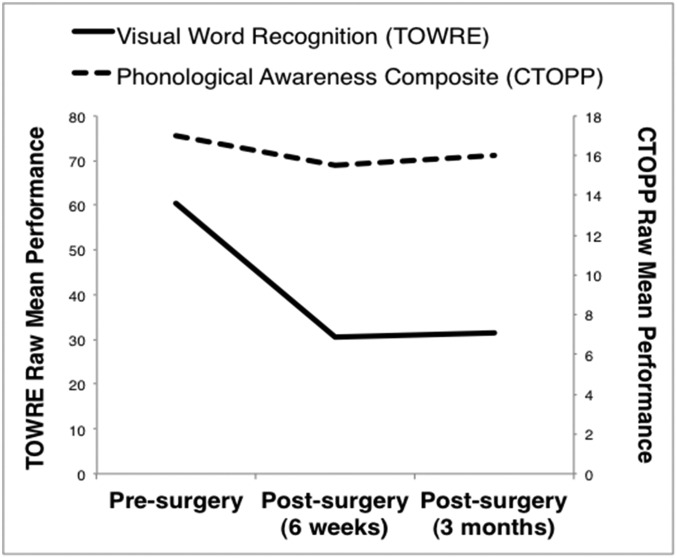
After completion of the iEEG study, in P1 a focal resection in the posterior basal temporal lobe was performed, which included removal of tissue at the location of the implanted VT electrode (Fig. S5), leading us to predict that P1 would exhibit postsurgical changes in visual word recognition consistent with acquired alexia (13). Neuropsychological assessments of naming times were conducted pre- and postsurgery at 1.5 wk (acute), 6 wk, and 3 mo to assess the impact of the resection on his perception of visual stimuli. P1 was asked to name words (three, five, or seven letters) (14) and a mixed set of stimuli (words, letters, single digits, three-digit numbers, famous faces, objects, music notes, and guitar tabs) aloud as rapidly and accurately as possible. After removal of the area surrounding the VT electrode, P1 showed the characteristics of acquired alexia—specifically, letter-by-letter reading (Fig. 3C), and longer naming times, particularly for letters and words (Fig. 3D), as predicted based on the role of this area in orthographic processing (13, 14). Additionally, orthographic processes were impacted to a greater degree than phonological processes by the resection (Fig. S6). See SI Results for further description and elaboration on P1’s postresection reading deficits.
Fig. S5.
P1 resection location. The former location of the same depth electrode (red line) is indicated on coregistered views of the postoperative MRI (A and B) in relation to the cortical regions that were resected (blue region).
Fig. 3.
The effect of stimulation on naming times in lmFG and pre- and postsurgery neuropsychological naming task performance. (A) The average naming reaction time for words, letters, and faces under low stimulation (1–5 mA) and high stimulation (6–10 mA) to lmFG electrodes in P1. Error bars correspond to SE, *P < 0.05. (B) The average naming reaction time for words and pictures under low stimulation (1–5 mA) and high stimulation (6–10 mA) to lmFG electrodes in P2. Error bars correspond to SE, ***P < 0.001. (C) Word length effect pre- and postsurgery in P1. (D) Average percent change in reaction time in the mixed naming task pre- vs. postsurgery in P1, ***P < 0.001.
Fig. S6.
P1 performance on neuropsychological tests. Visual word recognition (mean number of correctly named words in TOWRE sight word and phonemic decoding efficiency; presurgery: form A; postsurgery: form B) and phonological awareness (mean correct trials in CTOPP elision and blending words) were measured pre- and postsurgery (6 wk and 3 mo). P1’s postsurgery performance on a standardized test of visual word recognition (40) decreased to a greater extent compared with a test of phonological awareness, which remained stable after surgery (41) (Fig. S5); this suggests that P1’s resection disrupted orthographic, but not phonological processes.
The anatomical locus and category specificity of the recorded iEEG response in P1–P4, and the postresection alexia in P1, were highly consistent with our localization of lmFG electrodes to tissue that is central to the visual word form debate. We then tested specific putative indicators of the visual word form hypothesis using data obtained from cortical stimulation (P1 and P2) and iEEG (P1, P3, and P4) from these electrode sites.
Disrupting lmFG Activity Impairs Both Lexical and Sublexical Orthographic Processing.
One indicator of whether the lmFG functions as a specialized visual word form system is whether disrupting its activity using electrical stimulation impairs the normal perception of both printed words and sublexical orthographic components (26, 27), but not other kinds of visual stimuli. As part of presurgical language mapping, P1 and P2 underwent an electrical stimulation session where they named two kinds of orthographic stimuli [words (P1 and P2) and letters (P1)], as well nonorthographic objects [faces (P1) and pictures (P2)]. We hypothesized that high stimulation (6–10 mA) to the lmFG electrodes would cause greater disruption to reading orthographic stimuli than low stimulation (1–5 mA) due to the observed category specificity of the iEEG response, but no disruption would be seen for stimulation during object (face or picture) naming. Indeed, P1 and P2 were significantly slower at reading words at high stimulation than low stimulation [Fig. 3 A and B; P1: mean RTlow stim = 967 ms, mean RThigh stim = 1,860 ms, t(18) = 2.42, Cohen’s d = 1.14, P = 0.026; P2: mean RTlow stim = 1,586 ms, mean RThigh stim = 8,700 ms, t(7) = 11.28, Cohen’s d = 5.15, P < 0.001]. P1 also misidentified 5% of words (naming “number” as “nature”) under high stimulation on the lmFG electrodes. P2 did not misidentify any words, but was generally unable to name words until the stimulation had ceased. Her self-report suggested an orthographic disruption rather than speech arrest. Specifically, for the word “illegal,” she reported thinking two different words at the same time, and trying to combine them. For the word “message,” she reported thinking that there was an “N” in the word (Movie S1). P1 was also asked to name single letters during stimulation in lmFG electrodes. With limited letter trials during stimulation (two low stimulation and five high stimulation), there was no significant difference in reaction time in letter naming between high and low stimulation. However, P1 responded incorrectly to two letter stimuli, initially responding “A” for “X,” and responding “F” and then “H” to the visual stimulus “C,” both of which he had previously named accurately during the stimulation session (Movie S2). Importantly, naming times for nonorthographic stimuli were not significantly affected by stimulation in lmFG electrodes [P1, faces: mean RTlow stim = 1,211 ms, mean RThigh stim = 1,246 ms, t(12) = 0.11, Cohen’s d = 0.05, P = 0.92; P2, pictures: mean RTlow stim = 1,350 ms, mean RThigh stim = 1,490 ms, t(10) = 0.18, Cohen’s d = 0.13, P = 0.86]. (Naming times for pictures did not differ between low- and high-stimulation picture trials in P2 despite evidence of afterdischarges—abnormal activity that continues after stimulation is turned off—on three of four high-stimulation trials. No afterdischarges were seen during word naming.)
These results are consistent with previous reports of selective impairments due to stimulation in the lmFG for reading orthographic stimuli (29). Notably, the category-specific perceptual alteration seen in P1 and P2 reveals visual feature distortions that are similar to those reported for faces when stimulating right mFG (30). These stimulation results indicate that disruption of lmFG function impairs both the skilled identification of visual words and sublexical components of word forms (i.e., letters), supportive of the visual word form hypothesis.
Electrophysiological Evidence for a Visual Word Form Representation in the lmFG.
We next used techniques from machine learning in iEEG data from P1 and P4 to assess the sensitivity of lmFG to sublexical, orthographic statistics (bigram frequency) that has been hypothesized as an indicator for a visual word form system (16, 21). To examine the dynamics of orthographic statistic sensitivity, we used a multivariate temporal pattern analysis (MTPA) classification procedure to test how the lmFG represents aspects of orthographic knowledge critical to the word form hypothesis at different stages of the time course.
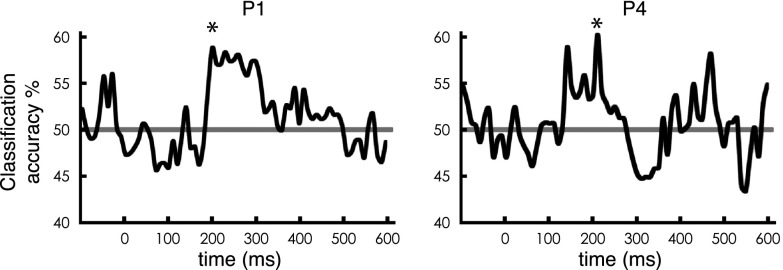
To measure sublexical sensitivity as a test of the word form hypothesis, P1 and P4 performed a covert naming task with high- and low-bigram frequency words, controlled for lexical frequency. The MTPA classifier was sensitive to differences between high- and low-bigram frequency during a relatively early time window in both participants (Fig. 4; P1: peak accuracy = 58.6%, P < 0.05 at 200–330 ms after stimulus onset; P4: peak accuracy = 60.2%, P < 0.05 at 210–310 ms after stimulus onset; all classification analyses were tested using permutation tests to correct for multiple comparisons). This finding is consistent with early discrimination in the basal temporal cortex between words and pseudowords in Kanji, which differ in the likelihood and order of cooccurrence of two characters within a word (31). It has been noted that testing the visual word form hypothesis requires examining the representation in lmFG that results primarily from feedforward input from earlier parts of the ventral visual processing stream (5). Thus, the result that sublexical aspects of orthographic information begin at a relatively early time point in processing is supportive of the word form hypothesis (5, 6, 16, 21, 32).
Fig. 4.
Dynamics of sensitivity to sublexical orthographic statistics (bigram frequency) in the lmFG. Classification accuracy time course for comparison between low-bigram frequency real words (low BG) vs. high-bigram frequency real words (high BG) in lmFG electrodes for P1 and P4, respectively, plotted against the beginning of the 100-ms sliding window. The classifier uses time-windowed single-trial potential signal from the electrodes from each subject (window length = 100 ms) with each time point in the window from each electrode as multivariate input features (see Methods for details). The asterisk (*) corresponds to the peak of the windows in which P < 0.05 corrected for multiple comparisons. The P = 0.05 significance threshold corresponds to accuracy = 58.2% (P1) and 59.3% (P4). The horizontal gray line at 50% indicates chance level.
Temporal Dynamics of Word Individuation in lmFG.
To further elucidate the dynamic nature of orthographic representation, we next looked at the sensitivity of lmFG to different aspects of individual words in P1, P3, and P4. Using words that varied in their degree of visual similarity (e.g., words that differed by one letter vs. all letters), we determined at what similarity level an MTPA classifier could discriminate between any two items. We found that at an early time window after stimulus onset, an MTPA classifier could significantly discriminate between words that did not share any letters (e.g., lint vs. dome; P1: peak classification accuracy = 59.6%, P < 0.05 from 120 to 250 ms; P3: peak classification accuracy = 58.3%, P < 0.05 from 180 to 360 ms; P4: peak classification accuracy = 60.3%, P < 0.05 from 100 to 430 ms, all P values were corrected for multiple time comparisons; Fig. 5), but could not discriminate between words that only differed by one letter (e.g., lint vs. hint; P1: peak classification accuracy = 52.7%, P > 0.1; P3: peak classification accuracy = 53.7%, P > 0.1; P4: peak classification accuracy = 56.6%, P > 0.05; Fig. 5). This result demonstrates an organization governed by an orthographic similarity space at the sublexical level, a finding consistent with our observation of bigram frequency effects in a relatively early time window. However, within a later time window, an MTPA classifier could discriminate between any two words (Fig. 5); notably, this includes word pairs with only one letter difference (P1: peak classification accuracy = 57.1%, P < 0.05 from 360 to 470 ms; P3: peak classification accuracy = 57.3%, P < 0.05 from 470 to 640 ms; P4: peak classification accuracy = 59.2%, P < 0.05 from 490 to 620 ms).
Fig. 5.
Dynamics of word individuation selectivity in the lmFG. Dynamics of averaged pairwise word individuation accuracy for different conditions in lmFG electrodes for P1, P3, and P4, respectively, plotted against the beginning of the 100-ms sliding window. The classifier uses time-windowed single-trial potential signal from the electrodes from each subject (window length = 100 ms) with each time point in the window from each electrode as multivariate input features (see Methods for details). The time course of the accuracy is averaged across all word pairs of the corresponding conditions. The colored areas indicate SEs. Similar pair: a pair of words that have the same length and are only different in one letter, e.g., lint and hint. Different pair: a pair of words that have the same length and are different in all letters, e.g., lint and dome. Horizontal gray line indicates chance level (accuracy = 50%). Colored asterisk (*) corresponds to the peak of the windows in which P < 0.05 corrected for multiple comparisons. The P = 0.05 significance threshold corresponds to accuracy = 56.5% (P1), 56.0% (P3), and 57.1% (P4).
SI Results
P1 showed no difference in reading times based on word length presurgery (mean reading times for three-, five-, and seven-letter words were 583, 589, and 582 ms, respectively; Fig. 3C). At 1.5 wk, 6 wk, and 3 mo postsurgery, P1 showed a linear increase in reading times as a function of word length after surgery and lmFG resection (mean latency: 1,583 ms), and there was a consistent letter-by-letter reading pattern in each session, with longer latencies for longer words (slopes of 277, 317, and 310 ms per letter in each session; see SI Methods for more details). A 2 × 3 ANOVA was conducted with session (pre- and postsurgery mean latencies) and word length (three, five, and seven letters) as repeated measures. There was a significant main effect of session, F(1, 39) = 557.75, η2 = 0.94, P < 0.001, with longer latencies in the postsurgery session, and a significant main effect of word length, F(2, 78) = 21.47, η2 = 0.36, P < 0.001, with longer words having greater latencies. Importantly, there was a significant interaction between session and word length, F(2, 78) = 23.33, η2 = 0.37, P < 0.001, such that the word length effect was greater postsurgery than presurgery.
Significant increases in naming times from presurgery to postsurgery (average of all three postsessions) were observed for words t(28) = 4.63, d = 1.74, P < 0.001, and letters, t(32) = 3.87, d = 1.35, P < 0.001, in addition to three-digit numbers, t(35) = 3.49, d = 1.18, P < 0.001 (t tests assuming unequal variances and df adjusted based on Levene’s test for equality of variances for all three conditions; Fig. 3D). The largest magnitude increase in naming times was observed with words (103%). The finding of slower numeral naming after removal of the lmFG is consistent with a weaker left hemisphere visual number form area that is also sensitive to letters and words (46). Significant changes were not found for any other categories. The selectivity of P1’s deficits confirms that the resected tissue was an integral component of a symbolic orthographic processing network that operates at both the sublexical and lexical levels.
Discussion
Our findings, which indicate that orthographic representation within the lmFG qualitatively shifts over time, provide a novel advancement on the debate about the visual word form hypothesis (1, 2). Specifically, we demonstrated that lmFG meets all of the proposed criteria for a visual word form system: early activity in lmFG coded for orthographic information at the sublexical level, disrupting lmFG activity impaired both lexical and sublexical perception, and early activity reflected an orthographic similarity space (24). Early activity in lmFG is sufficient to support a gist-level representation of words that differentiates between words with different visual statistics (e.g., orthographic bigram frequency).
Notably, the results in the late time window suggest that orthographic representation in lmFG shifts from gist-level representations to more precise representations sufficient for the individuation of visual words. In this late window, the lmFG became nearly insensitive to orthographic similarity as shown by similar classification accuracy for word pairs that differed by one letter compared with word pairs that were completely orthographically different (18). This kind of unique encoding of words is required to permit the individuation of visual words, a necessary step in word recognition (see Table 1 for summary). The time window in which this individuation signal is seen suggests that interactions with other brain regions transform the orthographic representation within the lmFG in support of word recognition. Such interactivity could function to integrate the orthographic, phonological, and semantic knowledge that together uniquely identifies a written word (23). Lack of spatiotemporal resolution to detect dynamic changes in lmFG coding of orthographic stimuli using fMRI may help to explain competing evidence for and against the visual word form hypothesis in the literature (5, 6).
Table 1.
Summary of electrophysiological results in early and late time windows
| Patient number | Word category sensitivity | Bigram frequency sensitivity | Word individuation | |||
| Early | Late | Early | Late | Early | Late | |
| P1 | ++ | + | ++ | - | - | ++ |
| P2 | ++ | + | ||||
| P3 | ++ | + | - | ++ | ||
| P4 | ++ | + | ++ | - | - | ++ |
The dynamic shift in the specificity of orthographic representation in the lmFG has a very similar time course as the coarse-to-fine processing shown in face-sensitive regions of the human fusiform (33). Considering that only an gist-level representation is available until ∼250 ms, and that saccade planning and execution generally occur within 200–250 ms during natural reading (34), the gist-to-individuated word-processing dynamic has important implications for neurobiological theories of reading; it suggests that when visual word form knowledge first makes contact with the language system, it is in the form of gist-level information that is insufficient to distinguish between visually similar alternatives. The identification of the early gist-level representation is consistent with evidence that readers are vulnerable to making errors in word individuation during natural reading, but contextual constraints are normally sufficient to avoid misinterpretations (35). In other words, in most cases, accurate individuation is achieved through continued processing that likely involves mutually constraining orthographic, phonological, semantic, and contextual information, resulting in a more precise individuated word representation.
Another notable pattern in the gist-to-individuation temporal dynamic is that during the later time window when individuation is significant (∼300–500 ms; Fig. 5), we found that the power to detect category-level word selectivity (i.e., words vs. bodies and scrambled images; Fig. 2), which arguably only requires gist-level discrimination, weakened and the event-related potential (ERP) response waned. This result is also consistent with a temporal selectivity pattern described for faces (33). One potential explanation for this selectivity and power shift could be that individuation is achieved by relatively few neurons (sparse coding) (36). Sparse coding would imply that relatively few word-sensitive neurons were active, and that the summed approximate word-related activity in this time period therefore would be weak. However, the neurons that were active encode for more precise word information, which would explain the significant word individuation reported here.
The mechanism underlying the representational shift from gist to individuation could have implications for models of reading disorders, such as dyslexia, where visual word identification is impaired (37). Indeed, the effects of lmFG stimulation, especially slower reading times, are suggestive of acquired (14) and developmental reading pathologies (38), which have been linked to dysfunction of lmFG (39). The extent to which individual word reading may be impaired by excess noise in the visual word form system, or the inadequate ability to contextually constrain noisy input into the language system, is for future research to untangle.
In summary, our results provide strong evidence that the lmFG is involved in at least two temporally distinguishable processing stages: an early stage that allows for category-level word decoding and gist-level representation organized by orthographic similarity, and a later stage supporting precise word individuation. An unanswered question is how the representation in the lmFG transitions between stages in these local neural populations and how interactions between areas involved in reading may govern these transitions. Taken together, the current results suggest a model in which lmFG contributes to multiple levels of orthographic representation via a dynamic shift in the computational analysis of different aspects of word information.
Methods
Subjects.
Four patients (two males, ages 25–45) undergoing surgical treatment for medicine-resistant epilepsy participated in the experiments. The patients gave written informed consent to participate in this study, under a protocol approved by the University of Pittsburgh Medical Center Institutional Review Board. See SI Methods for demographic and clinical information about each participant.
Experimental Paradigm.
The experiment paradigm and the data preprocessing method were similar to those described previously by Ghuman et al. (33). Paradigms were programmed in MATLAB using Psychtoolbox and custom-written code. All stimuli for the Category Localizer, Covert Naming, Word Individuation, and Stimulation were presented on a 22-inch LCD computer screen placed ∼2 m from the participant’s head at the center of the screen (∼10 × 10° of visual angle). All stimuli for P1–P3 were identical. Due to a considerable delay in testing, the covert naming and word individuation stimuli were modified and updated for P4 to address additional questions beyond the scope of the current study. However, the critical characteristics of the stimuli and contrasts in the analyses remain consistent across all four patients. The category localizer was identical for all patients.
Category Localizer.
Stimuli.
In the localizer experiment, 90 different images from three categories were used, with 30 images of bodies (50% male), 30 images of words, and 30 phase-scrambled images. Phase-scrambled images were created in MATLAB by taking the 2D Fourier transform of the image, extracting the phase, adding random phases, recombining the phase and amplitude, and taking the 2D inverse Fourier transform.
Design and procedure.
In the category localizer, each image was presented for 900 ms with 900-ms intertrial intervals, during which a fixation cross was presented at the center of the screen. There were two consecutive blocks in a session. Each block consisted of all 180 images with a random presenting order. At random, one-third of the time an image would be repeated, which yielded a total of 480 trials in one recording session. The participant was instructed to press a button on a button box when an image was repeated (one-back task).
Electrical Brain Stimulation.
Stimuli.
The stimuli used during electrode stimulation for P1 included 60 seven-letter words with 11.35 (10.60–13.67) mean log frequency, determined by the HAL Study used in the English Lexicon project (elexicon.wustl.edu/); single letters; and 13 famous faces that were familiar and nameable by P1. Stimuli were presented repeatedly during the session, starting with low-stimulation trials. Thus, stimuli presented during high-stimulation trials were likely to have been seen previously. The stimuli used during electrode stimulation for P2 included 46 seven-letter words with 10.93 (10.02–13.13) mean log frequency, and black-and-white pictures of common objects and animals. The 46 words that were presented during stimulation trials were out of a set of 155 words total that did not repeat.
Design and procedure.
Electrical current during stimulation passed between adjacent electrode pairs (e.g., 1 and 2; 3 and 4; etc.). During the stimulation session presurgery, stimulation (1–10 mA, peak-to-peak amplitude, which is the distance between the negative and positive square waves delivered to the two contacts, i.e., this is 2× the amplitude of the square waves) was alternatingly applied with sham stimulation, whereas P1 and P2 overtly named words (P1 and P2), letters (P1), famous faces (P1), and pictures (P2). Each stimulus trial began with a beep, followed by 750 ms of fixation and then the stimulus. The stimulus remained on the screen until it was named, after which an experimenter manually advanced to the next item. Naming times were computed by calculating the time between the beep and the response (minus 750 ms). Only trials in which the electrode stimulation overlapped with the first 500 ms of stimulus presentation were included in further statistical analyses. T-tests comparing high- and low-stimulation trials were computed assuming unequal variances and df adjusted based on Levene’s test for equality of variances.
Covert Naming: Sensitivity to Bigram Frequency.
Stimuli.
In the covert word-naming experiment, words with nonoverlapping high- and low-bigram frequency (70 each for P1, 40 each for P4), controlled for lexical frequency, were used as visual stimuli.
Design and procedure.
In the covert word-naming experiment, each word was presented once, in a random order, for 3,000 ms with 1,000-ms intertrial interval during which a fixation cross was presented at the center of the screen. The patient was instructed to press a button the moment when he began to covertly name the word to himself to ensure phonological encoding of each word and to avoid potential movement artifacts that could result from overt articulation.
Word Individuation.
Stimuli.
In the word individuation experiment, 20 different English words, with word length ranging from two to five, were used as visual stimuli. Similar word pairs differed by one letter, and different word pairs did not share any letters. All comparisons were made within the same word length.
Design and procedure.
In the word individuation experiment, each image was presented for 900 ms with 900-ms intertrial intervals, during which time a fixation cross was presented at the center of the screen. There were 24 consecutive blocks within a session. Each block consisted of all of the 20 words with a random order. At random, one-sixth of the time an image would be repeated, which yielded a total of 560 trials in one session. The patient was instructed to press a button on a button box when an image was repeated.
Multivariate Temporal Pattern Analysis.
Considering that the size of the training set was smaller than the data dimensionality, a low-variance classifier (specifically, Gaussian naïve Bayes) was used. Principle component analysis (PCA) and linear discriminant analysis (LDA) were used to lower the dimensions in the case of multiway categorical classifications. However, we found the dimensionality reduction method was not plausible in the pairwise words classification case, because the smaller number of trials made the estimation of covariance unreliable. For all classification analyses, the Gaussian naïve Bayes classifier was trained based on the data from each time point of 100-ms windows from single trials in the training set (the time course pattern from 100 ms of single-trial potentials) and was used to label the condition of the corresponding data from that time window from the testing trial. The classification accuracy was estimated by counting the correctly labeled trials. This procedure was then repeated for all time windows slid with 10-ms steps between −100 and ∼600 ms relative to the presentation of the stimuli.
For the multiway categorical classifications with K categories (here, K = 2 or 3), the classification accuracy was estimated through nested leave-P-out cross-validation. In the first level of cross-validation, single-trial potentials were first split into training (80% of the trials) and testing set (20% of the trials) randomly. For each random split, PCA was trained based on the training set to lower the dimensionality down to P. Then, LDA was used to project the data into K − 1 dimensional space. Finally, a Gaussian naïve Bayes classifier was trained based on the projected training set. The selection of the model parameter P was achieved by finding the P that gave greatest d′ for Bayes classification based on an additional level of random subsampling validation with 50 repeats using only the training set. After training, true positive and false alarm rates of the target condition were calculated across all of the test trials. The d′ was calculated as d′ = Z(true positive rate) – Z(false alarm rate), where Z is the inverse of the Gaussian cumulative distribution function. The random split was repeated 200 times, and the classification accuracy was estimated by averaging across results from these 200 random splits.
For the pairwise classification in the word individuation task, the pairwise classification accuracy was estimated through leave-one-out cross-validation. Specifically, for each pair of words, each trial was left out in turn as the testing trial, with the remaining trials used for the training set. Finally, the overall pairwise classification accuracy was estimated through averaging across all 190 word pairs. The classification accuracy for each specifically controlled condition was estimated by averaging the corresponding word pairs.
See SI Methods for details regarding statistical testing of classification accuracy.
SI Methods
Patient Medical History.
Patient P1 was a 25-y-old right-handed man with medically intractable epilepsy since the age of 7. The clinical onset of his partial complex, secondary generalizing seizures was characterized by behavioral arrest and inability to speak. His-3-Tesla (T) MRI was negative for any visible lesions. The patient had undergone two surgeries before the current one, first a partial anterior temporal lobectomy (7 y prior), and then a second surgery to complete the resection of residual mesial structures (1 y prior). The patient exhibited baseline low average to moderately impaired skills on IQ measures, but exhibited stable performance after his first and second surgeries, with the exception of a decline on a verbal memory task after the first surgery. Following further evaluation that included repeat video EEG and magnetoencephalography, the multidisciplinary epilepsy team recommended that the patient undergo intracranial monitoring via stereoelectroencephalography (SEEG) to attempt to definitively delineate the seizure focus. Ictal intracranial EEG suggested a seizure focus in the posterior left inferior temporal gyrus. Language mapping was performed for surgical planning purposes. The epilepsy board recommended resection of the presumed seizure onset zone that included portions of the middle, inferior and fusiform gyri, to which the patient consented, after discussion of the potential risks and benefits of surgery, including the eventuality of a reading impairment. The patient had a period of seizure freedom for 10 wk following surgery, but subsequently has continued to experience seizures.
Patient P2 was a 31-y-old female with a 4-y duration of medically intractable epilepsy, with seizures occurring several times per week. Seizures began as alteration of awareness, progressing to generalized convulsions. The patient’s highest level of education is college coursework, and neuropsychological testing revealed impairment in verbal greater than visual memory, with an estimate of overall intelligence in the low-average range. A 3T MRI was normal. She underwent left frontotemporal SEEG, which revealed seizure onset in the left anterior mesial temporal lobe. She underwent a left anterior temporal lobectomy and has remained seizure-free.
Patient P3 was a 41-y-old-man with a 3-y duration of medically intractable epilepsy, with seizures occurring several times per week. Seizures began with automatisms and alteration of awareness, progressing to alterations in speech. The patient’s highest level of education is a high school degree, and neuropsychological testing revealed deficits in verbal learning and memory skills, with overall intelligence estimated in the average range. A 3T MRI was normal. He underwent bilateral frontotemporal SEEG, which predominately revealed a left anterior temporal neocortical onset zone, with a possible smaller, independent focus in the right frontal operculum. He underwent a left anterior temporal lobectomy and has remained seizure-free.
Patient P4 was a 45-y-old female with an 11-y duration of medically intractable epilepsy, with seizures occurring several times per month. Seizures began with an aura of anxiety, progressing to automatisms, alteration of awareness, and tongue-biting. The patient’s highest level of education is a master of science, and neuropsychological testing revealed no lateralizing findings, with an estimate of overall intelligence in the high-average range. A 3T MRI revealed a lesion in the left inferior temporal gyrus consistent with low-grade glioma. She underwent intracranial monitoring via implantation of left temporal subdural grids and depth electrodes. Findings were consistent with perilesional seizure onset. She underwent resection of the lesion, found to be a ganglioglioma, and has remained seizure-free.
Neuropsychological tests.
Stimuli.
Neuropsychological assessments with P1 were conducted for research purposes before surgery and at 1.5 wk, 6 wk, and 3 mo postsurgery. Tasks included the word-naming test reported by Behrmann and coworkers (14) that manipulates word-length (40 of each three-, five-, and seven-letter words) with frequency and concreteness matched, and a mixed-naming test that included 10 of each type of the following stimuli: letters, six-letter words, single digits, three-digit numbers, famous faces known by the patient, pictures, and single musical notes and guitar tab chords (due to the patient’s interest in reading music). A broad array of standardized neuropsychological tests were administered pre- and postsurgery, but we only report the two most relevant to his reading ability: TOWRE [sight word efficiency and phonemic decoding efficiency tests (40)] and CTOPP phonological awareness [elision and blending words (41)], which were administered before surgery, and at 6 wk and 3 mo postsurgery (Fig. S6).
Design and procedure.
For both the word-length effect task and the mixed naming task, stimuli were presented in the center of the screen until they were named without a time limit. The patient pressed the spacebar upon naming the item, and all responses were recorded using a digital recorder. A fixation cross was displayed between each stimulus, and the patient had to press the spacebar again to display the next stimulus. A single tone was played simultaneously as the stimulus was presented, and precise naming times were later extracted from the digital auditory files using the Audacity program (sourceforge.net/projects/audacity). Standard procedures were followed for the TOWRE (40) and CTOPP (41).
iEEG Data Analysis.
Data preprocessing.
Local field potential data for the category localizer, covert naming, and word individuation tasks were collected at 1,000 Hz using a Grapevine neural interface system (Ripple, LLC); they were subsequently bandpass filtered offline from 1 to 115 Hz and notch filtered from 59 to 61 Hz, both using fifth-order Butterworth filters in MATLAB, to remove slow and linear drift, the line noise, and high-frequency noise. Raw data were inspected for ictal events, and none were found during experimental recordings. To further reduce potential artifacts in the data, trials with peak amplitude 5 SDs away from the mean across the rest of the trials or with absolute peak amplitude larger than 350 μV were eliminated. In addition, trials with a difference larger than 25 μV between consecutive sampling points were eliminated. These criteria resulted in the elimination of less than 1% of trials in each session.
Electrode selection.
Word-sensitive electrodes were chosen based on anatomical and functional considerations. Electrodes of interest were restricted to those that were located on the fusiform gyrus. In addition, electrodes were selected such that their peak three-way classification d′ score (see below for how this was calculated) exceeded 1 (P < 0.001 based on a permutation test, as described below) and the ERP for words was larger than the ERP for the other nonword object categories—namely, bodies and phase-scrambled images.
P1, P2, and P3 each had eight electrode contacts on a single strip on the ventral temporal lobe. P4 had 28 electrode contacts on two high-density strips on the ventral temporal lobe. For P1, of the eight electrode contacts, only the first three channels satisfied the criteria described above and all analyses included data from all three of these electrode channels. The remaining five channels failed to satisfy either of the two criteria. For P2, three of the eight electrode channels (channels 1, 3, and 4) satisfied the criteria. Only channels 3 and 4 were used for all analyses because channel 1 was noncontiguous with the other channels and more medial than would be expected for word sensitive lmFG. For P3, of the eight electrode channels, only one channel (the third electrode channel on the strip) satisfied the criteria. Hence we used the data from this one electrode channel for the multivariate classification analysis. For P4, three of the 28 high-density ventral temporal electrode channels satisfied the two criteria (channels 8, 9, and 22), and all analyses included data from all three of these channels. The precise locations varied slightly, which is a typical characteristic of word-selective cortex described in the literature (42). All patients’ postoperative structural MRIs were normalized to Talairach space using AFNI’s @auto_tlrc program to confirm the location of the word-selective contacts in the fusiform gyrus (Fig. 1).
Permutation test.
Permutation testing was used to assess the statistical significance of classification accuracy and the corresponding d′ value against the chance level for all of the classification analyses described above. Specifically, the null hypothesis could be stated as that the peak classification accuracy was at chance level, using a global null hypothesis over the entire time course; this results in significance values corrected for multiple time comparisons (43). For each permutation, the condition labels of all of the trials were randomly permuted, and the same classification procedure as described above was performed on the data with permuted labels. The maximum classification accuracy across the −100- to 600-ms time window was then extracted as the test statistic. The permutation procedure was repeated for N times (N is chosen heuristically between 200 and 1,000 based on the computational complexity of the problem and the accuracy of estimation that is needed). The estimated P value of the classification accuracy, corrected for multiple comparisons, was then determined based on the distribution that results from the permutation procedure.
Notably, the classification accuracy reported is generally greater than what is found using noninvasive measures of neural activity, such as fMRI (44). Nonetheless, the fact that iEEG pools over the activity of hundreds of thousands of neurons likely means that finer scale recordings, such as recording simultaneously from many single neurons, may have improved classification accuracy.
It is also notable that a recent study showed that combining both the single-trial potentials, as we did here, and the broadband signal results in higher classification accuracy than either of those signals alone (45). In our case, P3 showed clean single-trial potential data, but poor-quality broadband data. For that reason, we chose to use the single-trial potential data for all of our analyses. That said, in P1 and P4, the classification accuracy for single words did improve when combining single-trial potentials and the broadband signal, as predicted by Miller et al. (45). However, the classification accuracy improvement was quantitative and none of hypothesis testing (e.g., what was and was not significant at the P < 0.05 level), between time course comparisons, or indeed, none of the conclusions from the results changed when combining broadband and single-trial potential data.
Supplementary Material
Acknowledgments
We thank the patients and their families for their time and participation; the epilepsy monitoring unit staff, Cheryl Plummer, Gena Ghearing, and administration for assistance and cooperation with our research; Breana Gallagher for assistance with coding and analysis; Ellyanna Kessler, Roma Konecky, Nicolas Brunet, and Witold Lipski for assistance with data collection; Marlene Behrmann for assistance and access to stimuli for the letter-length neuropsychological test; and Daphne Bavelier and Charles Perfetti for helpful comments and feedback on this work. This work was supported by National Institute of Neurological Disorders and Stroke Award T32NS086749 (to E.A.H.), National Institute on Drug Abuse Awards R90DA023426 and R90DA023420 (to Y.L.), Eunice Kennedy Shriver National Institute of Child Health and Human Development Award R01HD060388 (to J.A.F.), and National Institute of Mental Health Award NIH R01MH107797 (to A.S.G.).
Footnotes
The authors declare no conflict of interest.
This article is a PNAS Direct Submission.
See Commentary on page 7938.
This article contains supporting information online at www.pnas.org/lookup/suppl/doi:10.1073/pnas.1604126113/-/DCSupplemental.
References
- 1.Bub DN, Arguin M, Lecours AR. Jules Dejerine and his interpretation of pure alexia. Brain Lang. 1993;45(4):531–559. doi: 10.1006/brln.1993.1059. [DOI] [PubMed] [Google Scholar]
- 2.Wernicke C. 1977. Der aphasischer symptomenkomplex: Eine psychologische studie auf anatomischer basis. Wernicke's Works on Aphasia: A Sourcebook and Review, ed Eggert GH (Mouton, The Hague), pp 91–145.
- 3.Warrington EK, Shallice T. Word-form dyslexia. Brain. 1980;103(1):99–112. doi: 10.1093/brain/103.1.99. [DOI] [PubMed] [Google Scholar]
- 4.Dehaene S, Le Clec’H G, Poline JB, Le Bihan D, Cohen L. The visual word form area: A prelexical representation of visual words in the fusiform gyrus. Neuroreport. 2002;13(3):321–325. doi: 10.1097/00001756-200203040-00015. [DOI] [PubMed] [Google Scholar]
- 5.Dehaene S, Cohen L. The unique role of the visual word form area in reading. Trends Cogn Sci. 2011;15(6):254–262. doi: 10.1016/j.tics.2011.04.003. [DOI] [PubMed] [Google Scholar]
- 6.Price CJ, Devlin JT. The interactive account of ventral occipitotemporal contributions to reading. Trends Cogn Sci. 2011;15(6):246–253. doi: 10.1016/j.tics.2011.04.001. [DOI] [PMC free article] [PubMed] [Google Scholar]
- 7.Dehaene S, et al. How learning to read changes the cortical networks for vision and language. Science. 2010;330(6009):1359–1364. doi: 10.1126/science.1194140. [DOI] [PubMed] [Google Scholar]
- 8.Schlaggar BL, McCandliss BD. Development of neural systems for reading. Annu Rev Neurosci. 2007;30:475–503. doi: 10.1146/annurev.neuro.28.061604.135645. [DOI] [PubMed] [Google Scholar]
- 9.Brem S, et al. Brain sensitivity to print emerges when children learn letter-speech sound correspondences. Proc Natl Acad Sci USA. 2010;107(17):7939–7944. doi: 10.1073/pnas.0904402107. [DOI] [PMC free article] [PubMed] [Google Scholar]
- 10.Ben-Shachar M, Dougherty RF, Deutsch GK, Wandell BA. The development of cortical sensitivity to visual word forms. J Cogn Neurosci. 2011;23(9):2387–2399. doi: 10.1162/jocn.2011.21615. [DOI] [PMC free article] [PubMed] [Google Scholar]
- 11.Xue G, Poldrack RA. The neural substrates of visual perceptual learning of words: Implications for the visual word form area hypothesis. J Cogn Neurosci. 2007;19(10):1643–1655. doi: 10.1162/jocn.2007.19.10.1643. [DOI] [PubMed] [Google Scholar]
- 12.Glezer LS, Kim J, Rule J, Jiang X, Riesenhuber M. Adding words to the brain’s visual dictionary: Novel word learning selectively sharpens orthographic representations in the VWFA. J Neurosci. 2015;35(12):4965–4972. doi: 10.1523/JNEUROSCI.4031-14.2015. [DOI] [PMC free article] [PubMed] [Google Scholar]
- 13.Gaillard R, et al. Direct intracranial, fMRI, and lesion evidence for the causal role of left inferotemporal cortex in reading. Neuron. 2006;50(2):191–204. doi: 10.1016/j.neuron.2006.03.031. [DOI] [PubMed] [Google Scholar]
- 14.Behrmann M, Shallice T. Pure alexia: A nonspatial visual disorder affecting letter activation. Cogn Neuropsychol. 1995;12(4):409–454. [Google Scholar]
- 15.McCandliss BD, Cohen L, Dehaene S. The visual word form area: expertise for reading in the fusiform gyrus. Trends Cogn Sci. 2003;7(7):293–299. doi: 10.1016/s1364-6613(03)00134-7. [DOI] [PubMed] [Google Scholar]
- 16.Binder JR, Medler DA, Westbury CF, Liebenthal E, Buchanan L. Tuning of the human left fusiform gyrus to sublexical orthographic structure. Neuroimage. 2006;33(2):739–748. doi: 10.1016/j.neuroimage.2006.06.053. [DOI] [PMC free article] [PubMed] [Google Scholar]
- 17.Cohen L, et al. Language-specific tuning of visual cortex? Functional properties of the visual word form area. Brain. 2002;125(Pt 5):1054–1069. doi: 10.1093/brain/awf094. [DOI] [PubMed] [Google Scholar]
- 18.Glezer LS, Jiang X, Riesenhuber M. Evidence for highly selective neuronal tuning to whole words in the “visual word form area”. Neuron. 2009;62(2):199–204. doi: 10.1016/j.neuron.2009.03.017. [DOI] [PMC free article] [PubMed] [Google Scholar]
- 19.Farah MJ, Wallace MA. Pure alexia as a visual impairment: A reconsideration. Cogn Neuropsychol. 1991;8(3-4):313–334. [Google Scholar]
- 20.Price CJ, Devlin JT. The myth of the visual word form area. Neuroimage. 2003;19(3):473–481. doi: 10.1016/s1053-8119(03)00084-3. [DOI] [PubMed] [Google Scholar]
- 21.Vinckier F, et al. Hierarchical coding of letter strings in the ventral stream: dissecting the inner organization of the visual word-form system. Neuron. 2007;55(1):143–156. doi: 10.1016/j.neuron.2007.05.031. [DOI] [PubMed] [Google Scholar]
- 22.Wandell BA. The neurobiological basis of seeing words. Ann N Y Acad Sci. 2011;1224(1):63–80. doi: 10.1111/j.1749-6632.2010.05954.x. [DOI] [PMC free article] [PubMed] [Google Scholar]
- 23.Whaley ML, Kadipasaoglu CM, Cox SJ, Tandon N. Modulation of orthographic decoding by frontal cortex. J Neurosci. 2016;36(4):1173–1184. doi: 10.1523/JNEUROSCI.2985-15.2016. [DOI] [PMC free article] [PubMed] [Google Scholar]
- 24.Baeck A, Kravitz D, Baker C, Op de Beeck HP. Influence of lexical status and orthographic similarity on the multi-voxel response of the visual word form area. Neuroimage. 2015;111:321–328. doi: 10.1016/j.neuroimage.2015.01.060. [DOI] [PMC free article] [PubMed] [Google Scholar]
- 25.Maurer U, Brandeis D, McCandliss BD. Fast, visual specialization for reading in English revealed by the topography of the N170 ERP response. Behav Brain Funct. 2005;1(1):13. doi: 10.1186/1744-9081-1-13. [DOI] [PMC free article] [PubMed] [Google Scholar]
- 26.Nobre AC, Allison T, McCarthy G. Word recognition in the human inferior temporal lobe. Nature. 1994;372(6503):260–263. doi: 10.1038/372260a0. [DOI] [PubMed] [Google Scholar]
- 27.Hamamé CM, et al. Dejerine’s reading area revisited with intracranial EEG: Selective responses to letter strings. Neurology. 2013;80(6):602–603. doi: 10.1212/WNL.0b013e31828154d9. [DOI] [PubMed] [Google Scholar]
- 28.Hamamé CM, et al. Functional selectivity in the human occipitotemporal cortex during natural vision: Evidence from combined intracranial EEG and eye-tracking. Neuroimage. 2014;95:276–286. doi: 10.1016/j.neuroimage.2014.03.025. [DOI] [PubMed] [Google Scholar]
- 29.Mani J, et al. Evidence for a basal temporal visual language center: Cortical stimulation producing pure alexia. Neurology. 2008;71(20):1621–1627. doi: 10.1212/01.wnl.0000334755.32850.f0. [DOI] [PubMed] [Google Scholar]
- 30.Parvizi J, et al. Electrical stimulation of human fusiform face-selective regions distorts face perception. J Neurosci. 2012;32(43):14915–14920. doi: 10.1523/JNEUROSCI.2609-12.2012. [DOI] [PMC free article] [PubMed] [Google Scholar]
- 31.Tanji K, Suzuki K, Delorme A, Shamoto H, Nakasato N. High-frequency γ-band activity in the basal temporal cortex during picture-naming and lexical-decision tasks. J Neurosci. 2005;25(13):3287–3293. doi: 10.1523/JNEUROSCI.4948-04.2005. [DOI] [PMC free article] [PubMed] [Google Scholar]
- 32.Duncan KJ, Pattamadilok C, Devlin JT. Investigating occipito-temporal contributions to reading with TMS. J Cogn Neurosci. 2010;22(4):739–750. doi: 10.1162/jocn.2009.21207. [DOI] [PMC free article] [PubMed] [Google Scholar]
- 33.Ghuman AS, et al. Dynamic encoding of face information in the human fusiform gyrus. Nat Commun. 2014;5:5672. doi: 10.1038/ncomms6672. [DOI] [PMC free article] [PubMed] [Google Scholar]
- 34.Reichle ED, Pollatsek A, Fisher DL, Rayner K. Toward a model of eye movement control in reading. Psychol Rev. 1998;105(1):125–157. doi: 10.1037/0033-295x.105.1.125. [DOI] [PubMed] [Google Scholar]
- 35.Levy R, Bicknell K, Slattery T, Rayner K. Eye movement evidence that readers maintain and act on uncertainty about past linguistic input. Proc Natl Acad Sci USA. 2009;106(50):21086–21090. doi: 10.1073/pnas.0907664106. [DOI] [PMC free article] [PubMed] [Google Scholar]
- 36.Young MP, Yamane S. Sparse population coding of faces in the inferotemporal cortex. Science. 1992;256(5061):1327–1331. doi: 10.1126/science.1598577. [DOI] [PubMed] [Google Scholar]
- 37.Bruck M. Word-recognition skills of adults with childhood diagnoses of dyslexia. Dev Psychol. 1990;26(3):439. [Google Scholar]
- 38.Bowers PG, Wolf M. Theoretical links among naming speed, precise timing mechanisms and orthographic skill in dyslexia. Read Writ. 1993;5(1):69–85. [Google Scholar]
- 39.Martin A, Kronbichler M, Richlan F. Dyslexic brain activation abnormalities in deep and shallow orthographies: A meta-analysis of 28 functional neuroimaging studies. Hum Brain Mapp. April 7, 2016 doi: 10.1002/hbm.23202. [DOI] [PMC free article] [PubMed] [Google Scholar]
- 40.Torgesen JK, Wagner R, Rashotte C. TOWRE–2 Test of Word Reading Efficiency. Pro-Ed; Austin, TX: 1999. [Google Scholar]
- 41.Wagner RK, Torgesen JK, Rashotte CA. Comprehensive Test of Phonological Processing. Pro-Ed; Austin, TX: 1999. [Google Scholar]
- 42.Glezer LS, Riesenhuber M. Individual variability in location impacts orthographic selectivity in the “visual word form area”. J Neurosci. 2013;33(27):11221–11226. doi: 10.1523/JNEUROSCI.5002-12.2013. [DOI] [PMC free article] [PubMed] [Google Scholar]
- 43.Maris E, Oostenveld R. Nonparametric statistical testing of EEG- and MEG-data. J Neurosci Methods. 2007;164(1):177–190. doi: 10.1016/j.jneumeth.2007.03.024. [DOI] [PubMed] [Google Scholar]
- 44.Nestor A, Behrmann M, Plaut DC. The neural basis of visual word form processing: A multivariate investigation. Cereb Cortex. 2013;23(7):1673–1684. doi: 10.1093/cercor/bhs158. [DOI] [PubMed] [Google Scholar]
- 45.Miller KJ, Schalk G, Hermes D, Ojemann JG, Rao RP. Spontaneous decoding of the timing and content of human object perception from cortical surface recordings reveals complementary information in the event-related potential and broadband spectral change. PLOS Comput Biol. 2016;12(1):e1004660. doi: 10.1371/journal.pcbi.1004660. [DOI] [PMC free article] [PubMed] [Google Scholar]
- 46.Shum J, et al. A brain area for visual numerals. J Neurosci. 2013;33(16):6709–6715. doi: 10.1523/JNEUROSCI.4558-12.2013. [DOI] [PMC free article] [PubMed] [Google Scholar]
Associated Data
This section collects any data citations, data availability statements, or supplementary materials included in this article.


