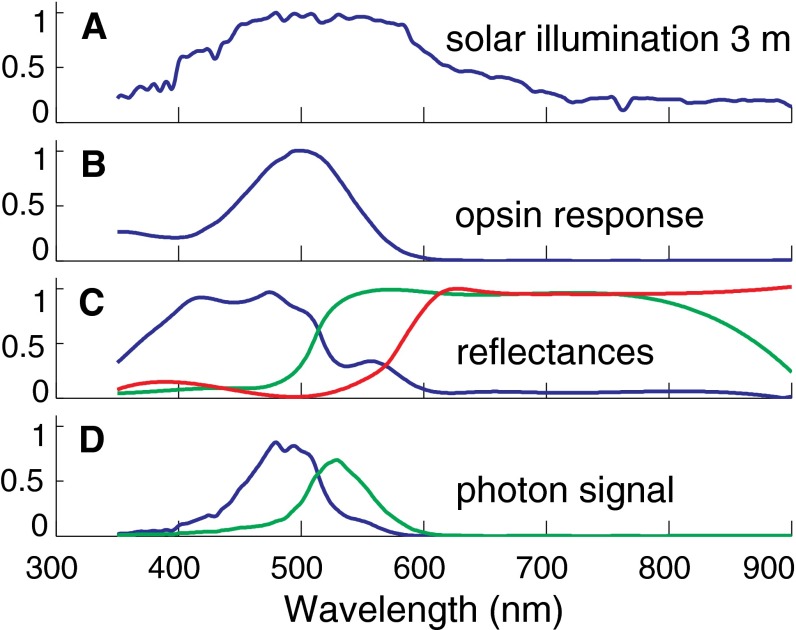
Fig. S3.
Spectra used in simulations showing the wavelength dependence (in nanometers) of multiple quantities of interest. All plotted quantities are dimensionless and normalized. (A) Depth-attenuated solar photon spectrum. (B) The sole opsin’s relative photon sensitivity response function from the work by Chung (6). (C) The three fish reflectance spectra that we used from blue, green, and red Australian reef fish (50). (D) Detected photon flux for the two bluest reflectance spectra that were used for the test patterns shown in Fig. 4.

