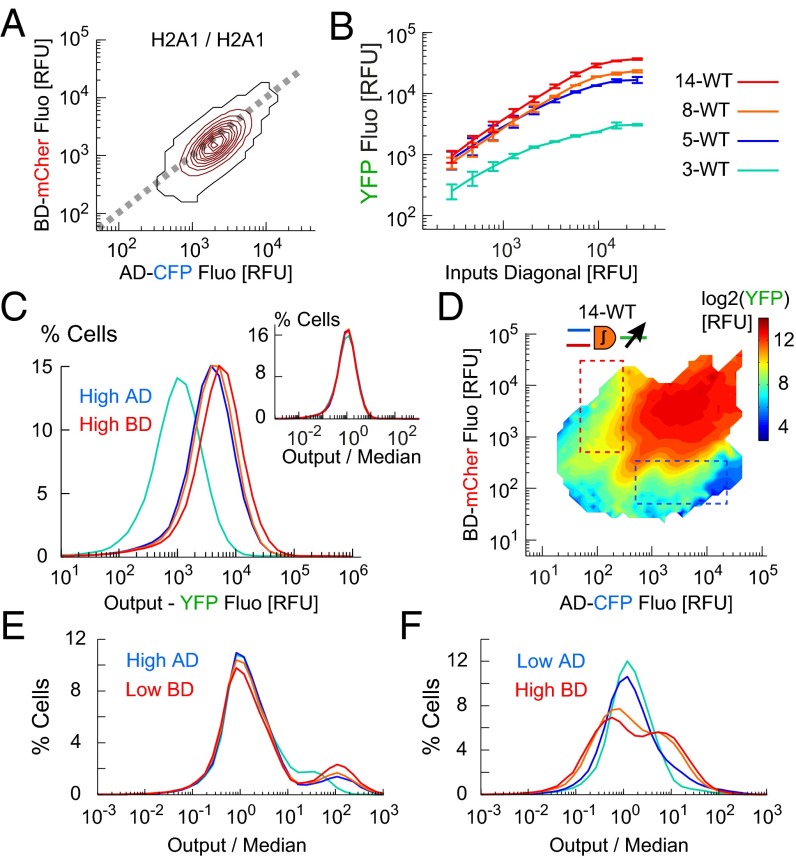
Fig. 3.
Amplification of response function by output promoter binding repeats. (A) Input space for the H2A1/H2A1 promoter pair. Most of the cells (90%) are within the red contours. (B) Output expression along the inputs diagonal (dashed line in A, median ± SD, n = 3 experiments). (C) Output distributions for the H2A1/H2A1 promoter pair (3–14 BS repeats as in B, 3 × 10⁵ cells per design). (Inset) Output distributions normalized by median values. (D) Response function map of 14-WT design (9 × 10⁵ cells, single experiment). (E and F) Output distributions normalized by median for cells below activation gates (105 cells per design), with high level of AD (E, blue dashed box in D), or high level of BD (F, red dashed box in D).

