Fig. 6.
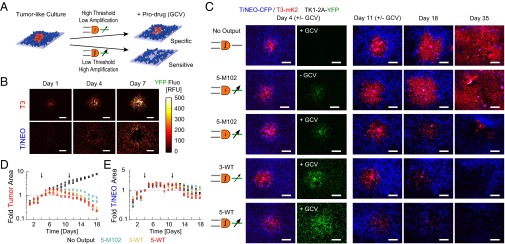
The 2D tumor-like platform for cancer targeting evaluation. (A) Islets of T3 in T/NEO background infected by DPI with HSV-TK1 output were exposed to GCV to assess designs sensitivity and specificity. (B) Output levels (YFP) of 5-M102 design during tumor growth. Pixels from T/NEO or T3 cells were obtained based on constitutive CFP and mKate2 expression. (C) Fluorescence microscopy images of the tumor-like cocultures at different time points for DPI designs as denoted in left column (T/NEO in blue, T3 in red). In green, output level at day of first treatment. (D and E) Pixel count of area, in fold relative to day of first treatment, occupied by T3 (D) and T/NEO (E) as identified by their respective constitutive color. Black arrows indicate a 24-h GCV treatment. Circles and squares represent two experiments. (Scale bar, 1 mm.)

