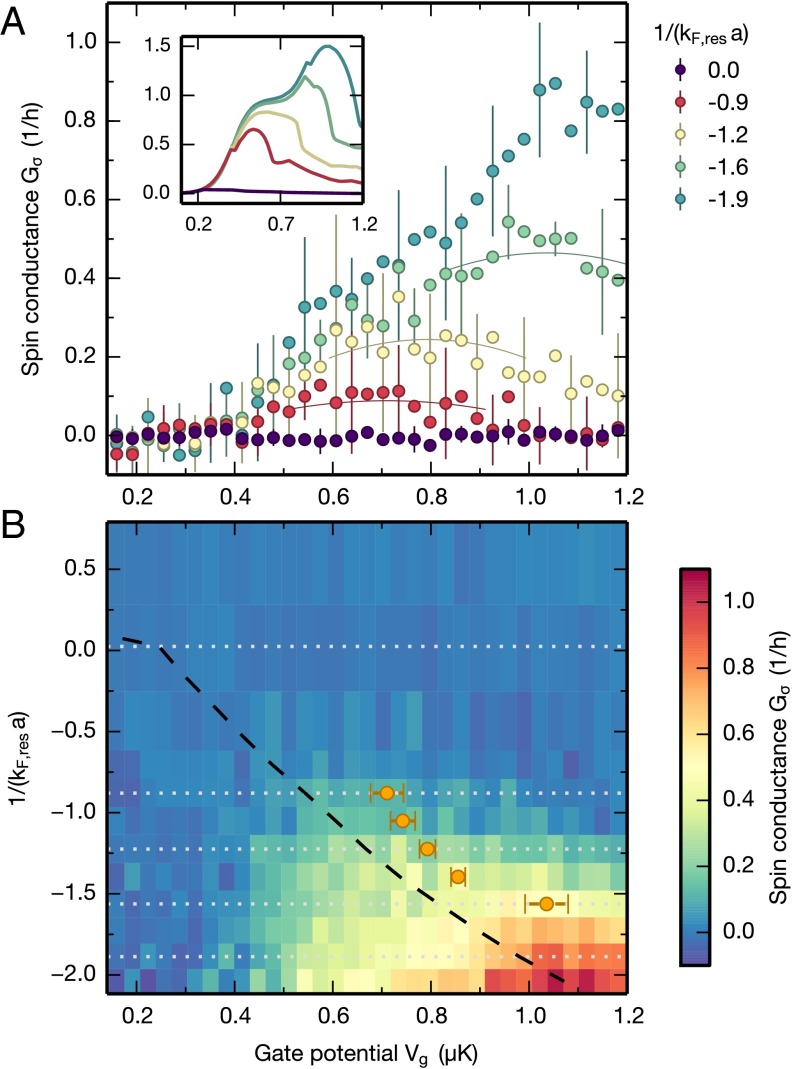
Fig. 2.
Spin conductance of the attractively interacting Fermi gas. (A) Spin conductance as a function of the gate potential for different interaction strengths in the reservoirs. Each data point represents the mean over nine measurements and error bars indicate 1 SD plotted for every third point. The thin solid lines are quadratic fits used to identify the maxima in Inset shows obtained from a mean-field phenomenological model, reproducing the nonmonotonic behavior of the experimental data. (B) Two-dimensional color plot of as a function of with cuts of A indicated as gray dotted lines. The points where is maximum, obtained from a parabolic fit along are displayed as orange circles for comparison. The black dashed line represents the superfluid critical line estimated at the entrance and exit regions of the QPC, using the results of ref. 38.

