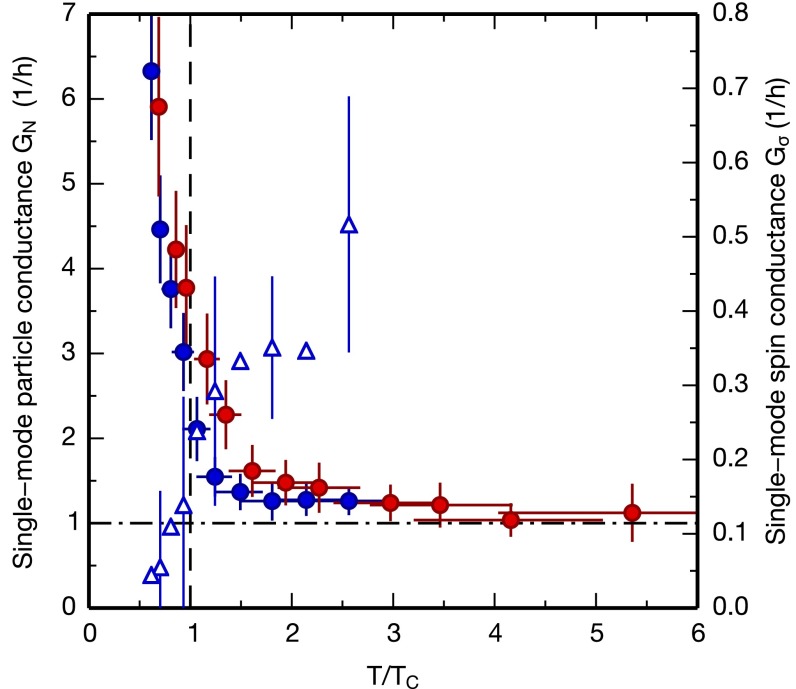
Fig. 4.
Particle and spin conductances in the single-mode regime. (solid circles) and (open triangles, every second error bar displayed) for various interaction strengths are presented as a function of the reduced temperature which varies due to the dependence of on density and scattering length. Blue data points are obtained from the measurements shown in Figs. 2 and 3 B and D for μK and kHz. Red data points are obtained from the measurements shown in Fig. 3 A and C for μK and kHz. tends to the conductance quantum (horizontal dashed-dotted line) for weak interactions (). Error bars contain statistical and systematic errors (Materials and Methods).

