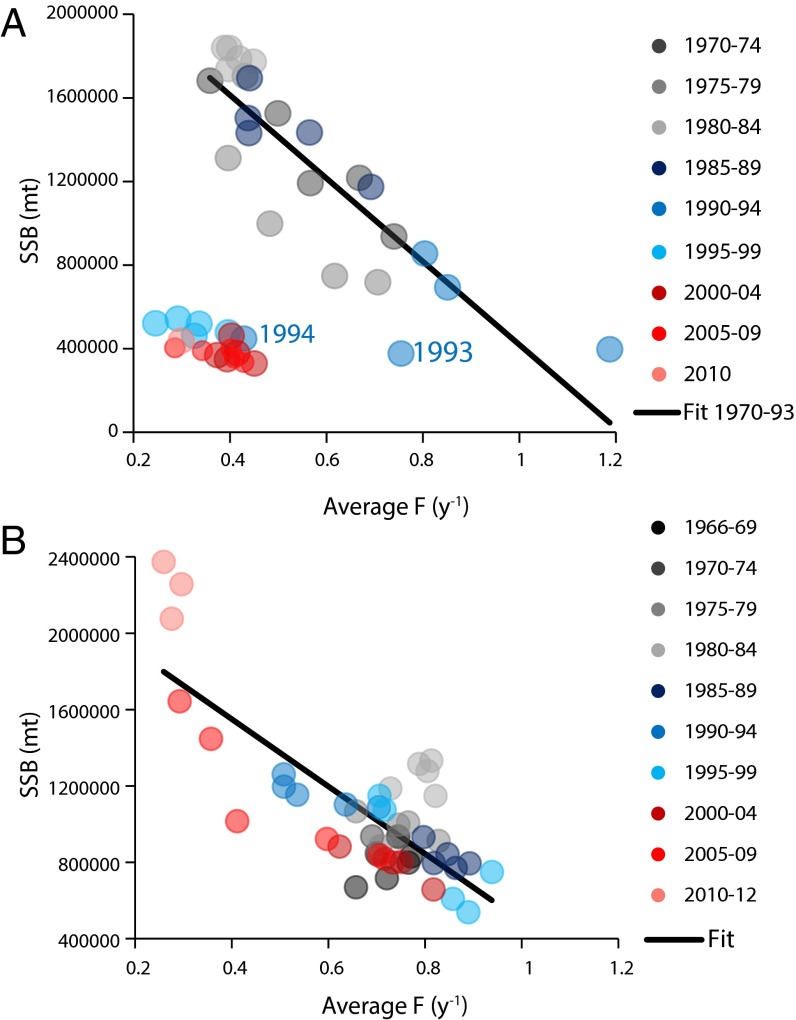
Fig. 2.
Comparison of the F values in year y and the response to this level of exploitation represented by SSB in year y+1 for the (A) NW and (B) NE Atlantic. The 13 (NW) and 9 (NE) SSB of cod stocks were combined, as were the F estimates, to represent two integrated stocks for the North Atlantic. Given that exploitation generally affects the following year’s biomass, we compared F in year y with SSB in the following year, y+1. The data are color-coded in 5-y blocks to allow the temporal evolution of SSB and F to be seen.

