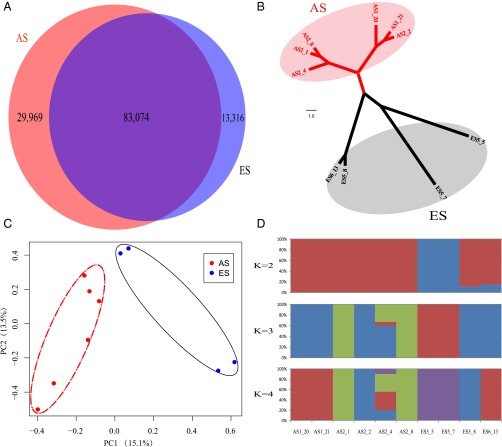
Fig. 2.
Population divergence of spiny mouse, A. cahirinus, at EC I. (A) Venn diagram of SNPs unique to the AS and ES populations. (B) NJ tree of the AS (red) and ES (gray) populations. (C) PCA of the AS and ES populations. (D) Population genetic structure of the AS and ES populations when K was set to two, three, or four. Note that AS is the south-facing slope, whereas ES is the north-facing slope. The ecological divergence between the slopes is like between two continents, despite the very short distance separating them (on average 250 m).

