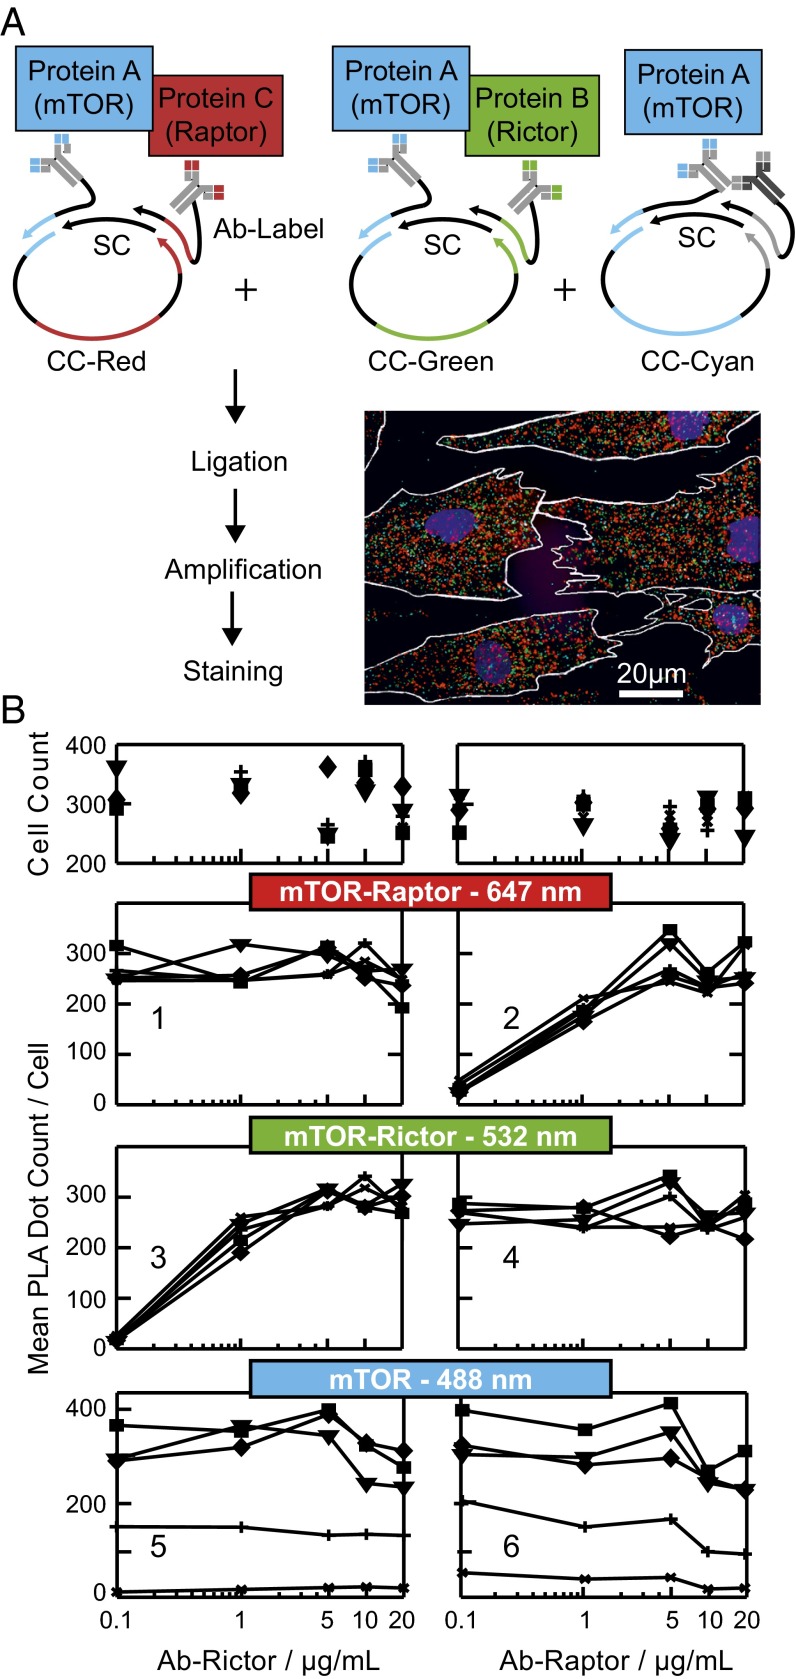
Fig. 2.
mPLA for on-chip analysis of protein–protein interaction and protein expression in hASCs. (A) PLA workflow to target three protein events in parallel within a single cell. The multicolor fluorescence image shows representative PLA results for hASCs after in situ staining. The red, cyan, and green PLA dots report on the mTOR–Raptor and mTOR–Rictor protein interactions and mTOR expression levels, respectively. CC and SC denote for the shared and coding connector strand, respectively. (B) Orthogonality of the in situ mPLA system. Rows 2–4 show the PLA dot counts per cell for three individual test systems on increasing (Left) Rictor or (Right) Raptor Ab concentrations. The Ab concentration for mTOR was constant (10 µg/mL) in all experiments, whereas the secondary Ab targeting the mTOR Ab changed from 0.1 (*), 1 (+), 5 (▼), and 10 (■) to 20 µg/mL (♦). Row 1 shows the cell count number used to extract the corresponding PLA result in rows 2–4.

