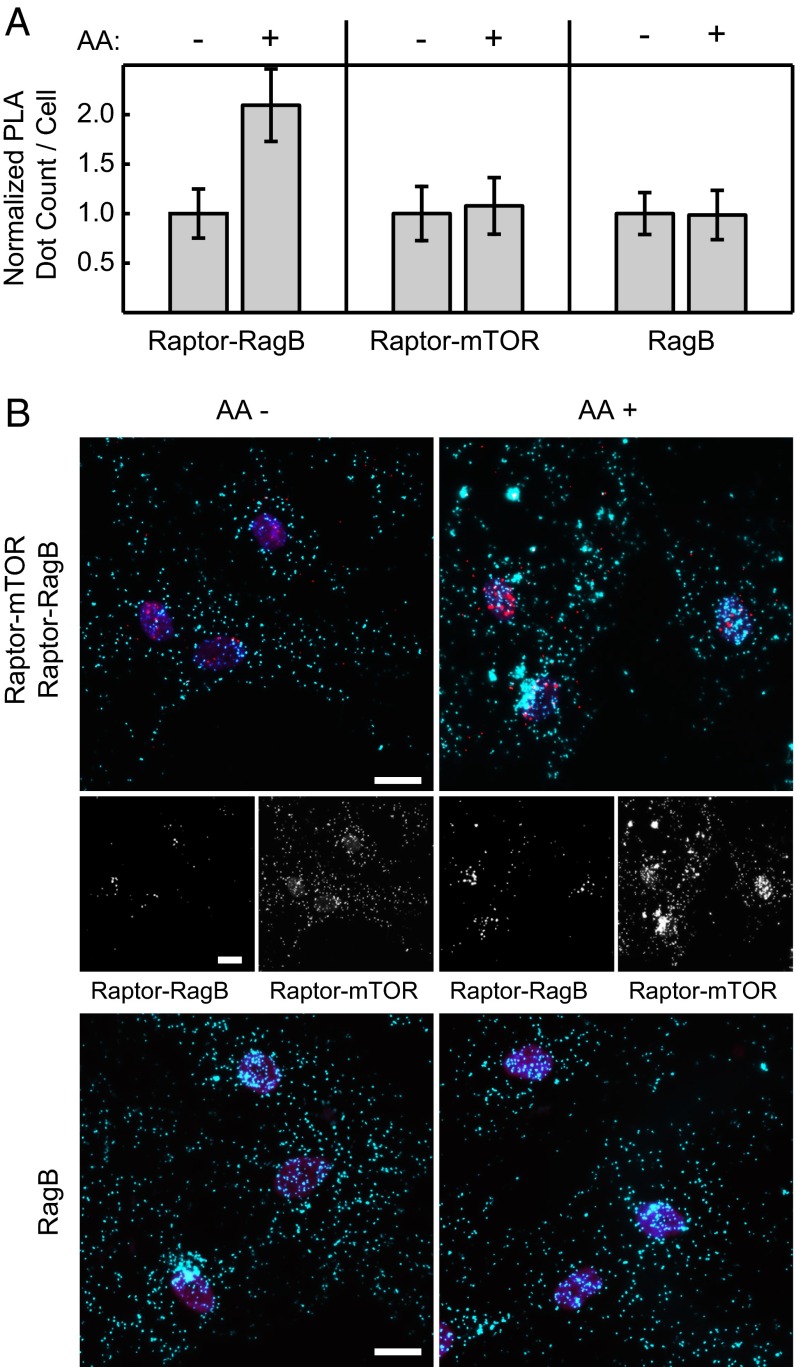
Fig. 3.
mTORC1 protein interaction changes on amino acid starvation and recovery in hASCs. (A) Normalized PLA dot count per cell for (Left) the Raptor–RagB , (Center) Raptor–mTOR interactions, and (Right) RagB protein abundance. All hASCs were amino acid (AA)-starved for 50 min, a portion of the cells was replenished with amino acids for 10 min, and all cells were fixed at the same time. (B) Representative PLA images of the hASCs corresponding to the conditions in A. In Top, red and cyan dots denote Raptor–RagB mPLA signal and Raptor–mTOR mPLA signal, respectively. Middle represents mPLA signals in each single channel. In Bottom, cyan dots denote RagB PLA signal. Nuclei (magenta) are stained with DAPI. (Scale bars: 20 μm.)

