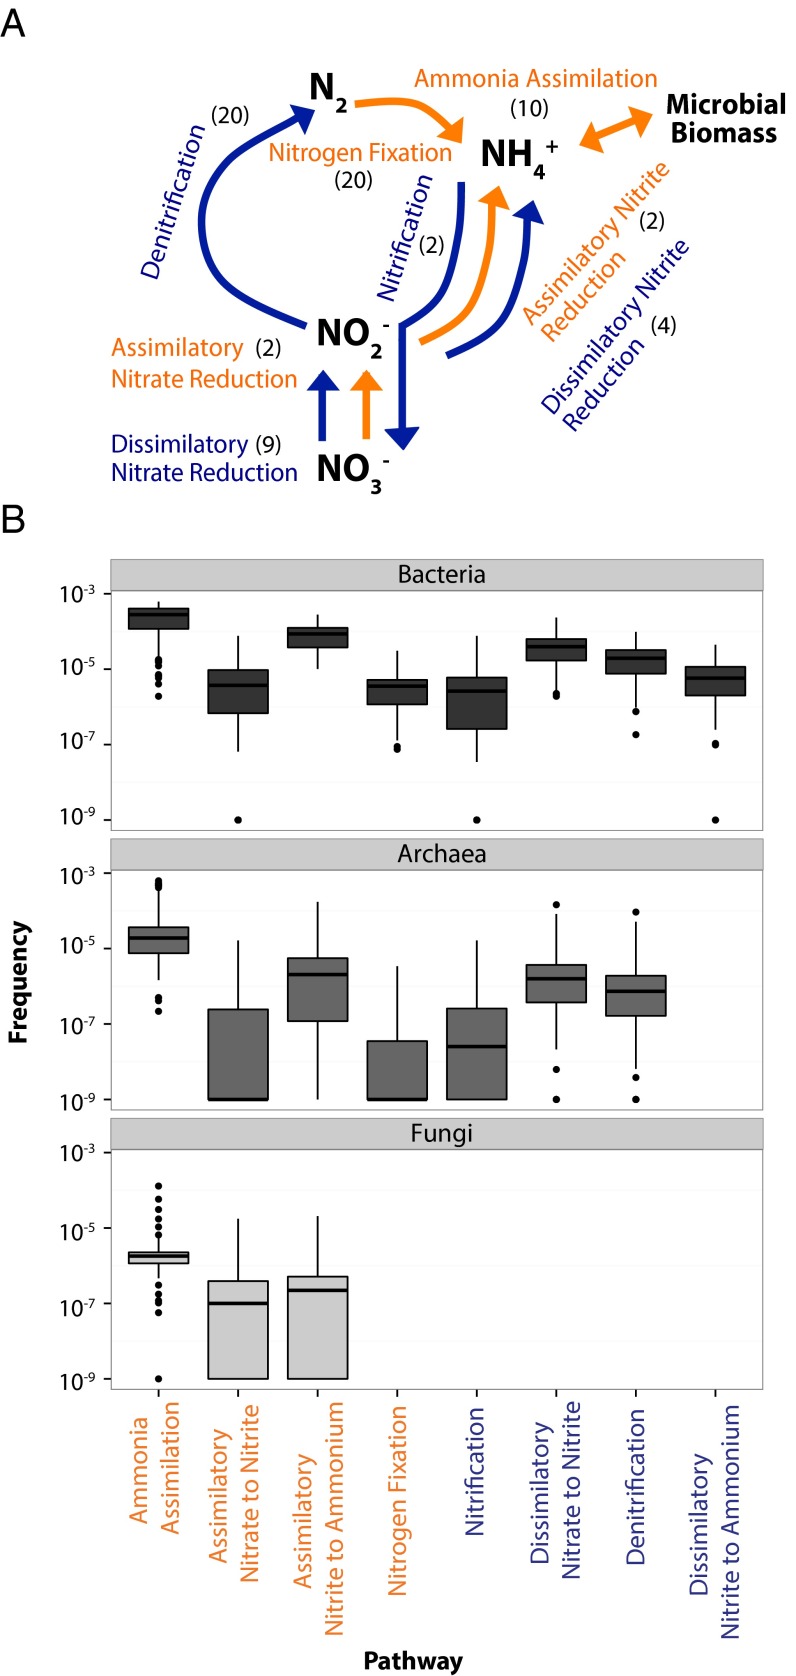
Fig. 2.
N pathways and their frequencies. (A) N pathways considered in this study. The numbers in parentheses are the number of genes targeted for each pathway. Assimilatory pathways are in orange and dissimilatory pathways in blue. (B) Box plot of the frequency of each N pathway in a metagenomic library for Bacteria, Archaea, and Fungi. To compare across domains, frequencies are calculated as per annotated sequence in each domain. The upper and lower bounds of boxes correspond to the 25th and 75th percentiles, with a median line shown. Whiskers represent 1.5*IQR (interquartile range). Dots represent outliers.

