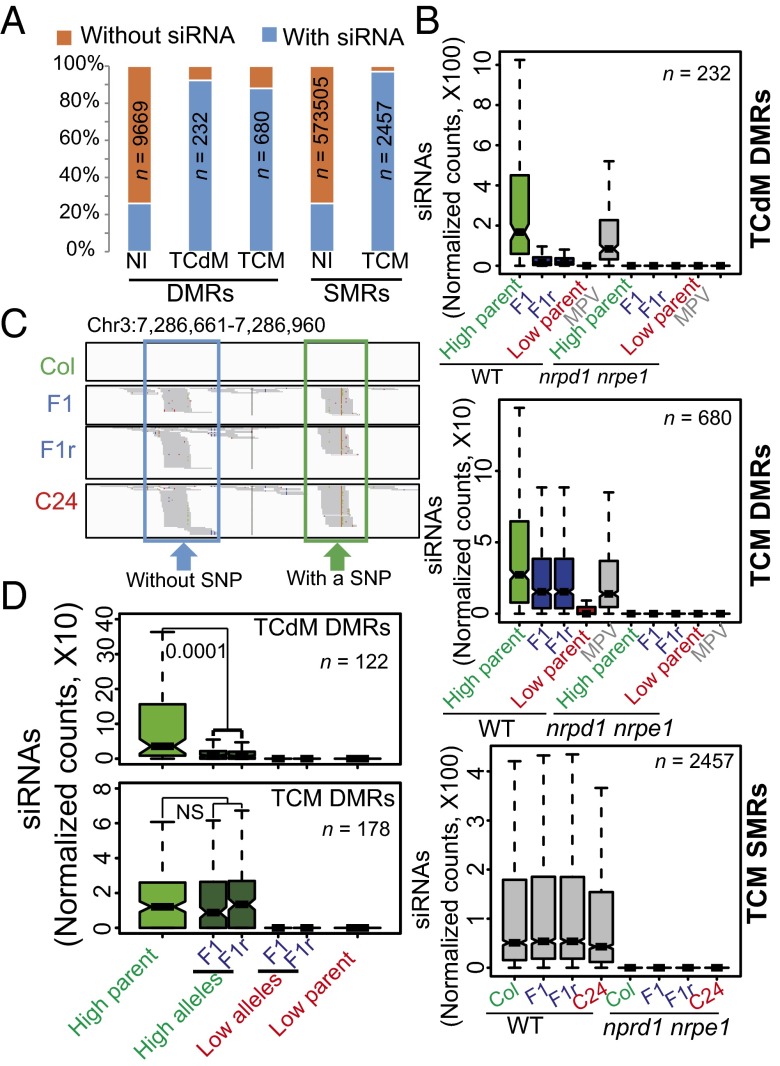
Fig. 4.
Analysis of 24-nt siRNAs associated with methylation interaction regions. (A) Percentages of regions with or without siRNAs in NI DMRs, TCM DMRs, TCdM DMRs, NI SMRs, and TCM SMRs. The siRNA enrichment in the high parent was used for each DMR, and the siRNA enrichment in the Col parent was used for each SMR. (B) Abundances of 24-nt siRNAs at TCM DMRs, TCdM DMRs, and TCM SMRs in the parents and F1 hybrids in WT and nrpd1nrpe1. (C) Screen shot from siRNA sequencing that shows siRNA abundance of a TCM DMR region in Fig. 2C. The SNP in the green boxed region is indicated by a red line. (D) Allele-specific analysis of siRNAs in TCdM and TCM DMRs. siRNA abundance was calculated as reads per million (RPM). P > 0.05. NS, not significant.

