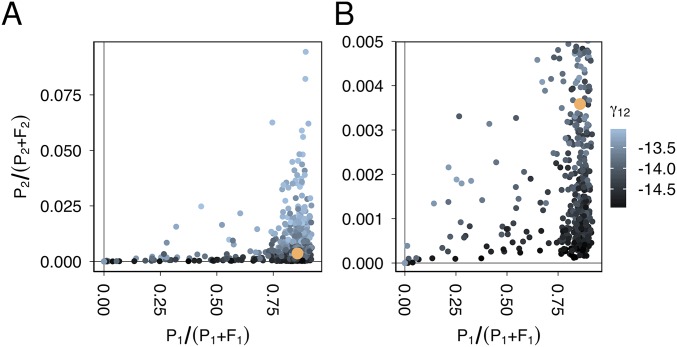
Fig. S2.
Plasmid frequency in species 2 was strongly dependent on plasmid frequency in species 1 and the interspecific conjugation rate. (A) Endpoint plasmid frequencies from species 1 were plotted against endpoint frequencies species 2 for the 1,000 model simulation described in Fig. S1. Points are colored according to (interspecific conjugation rate from species 1 to species 2), except for one point in orange which shows the output of the originally parameterized model (Fig. 2). (B) Zoomed-in plot of A. Note that, even with low values of , the plasmid is present in species 2, provided it is maintained in species 1.

