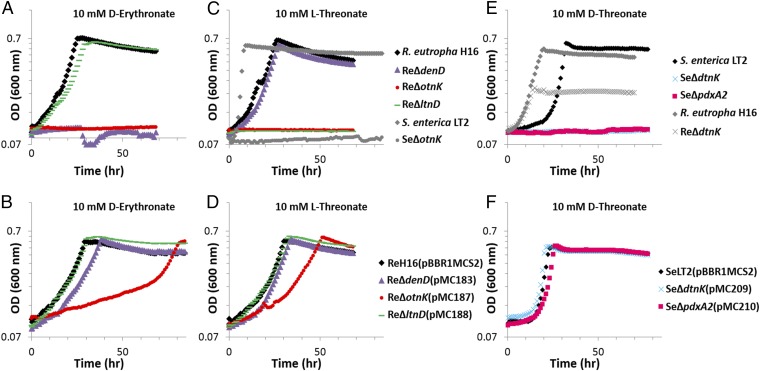
Fig. 3.
Growth of selected wild-type, mutant strains (A, C, E), and complemented strains (B, D, F) with 10 mM d-erythronate (A, B), 10 mM l-threonate (C, D), or 10 mM d-threonate (E, F). The same color (similar to SI Appendix, Figs. S4 and S8) and marker represent growth of a strain (A, C, E) and the corresponding complemented strain (B, D, F) for each growth condition. Gray markers represent strains for which no complementation data were collected. Strain identities are presented in the above legends. Plasmid identities are detailed in SI Appendix, Table S13 and strain identities are detailed in SI Appendix, Table S12. For complete growth data, see SI Appendix, Figs. S13–S17.

