Fig. 5.
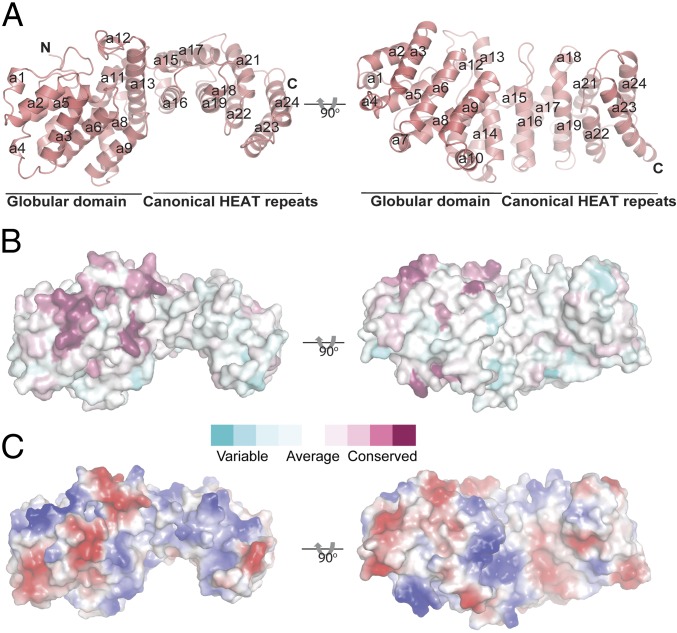
Structure of the N-terminal domain of Ltn1. (A) The structure of the Ltn1 NTD depicted as a schematic model in two orientations. Helices are labeled from a1 to a24, N and C termini are labeled N and C, respectively. The N-terminal globular domain and C-terminal canonical HEAT repeat regions are indicated. (B) Surface representation of Ltn1 with the sequence conservation mapped onto the surface. (C) Surface representation of Ltn1 with the electrostatic potential mapped onto the surface, with blue and red indicating positive and negative potential, respectively.

