Fig. 1.
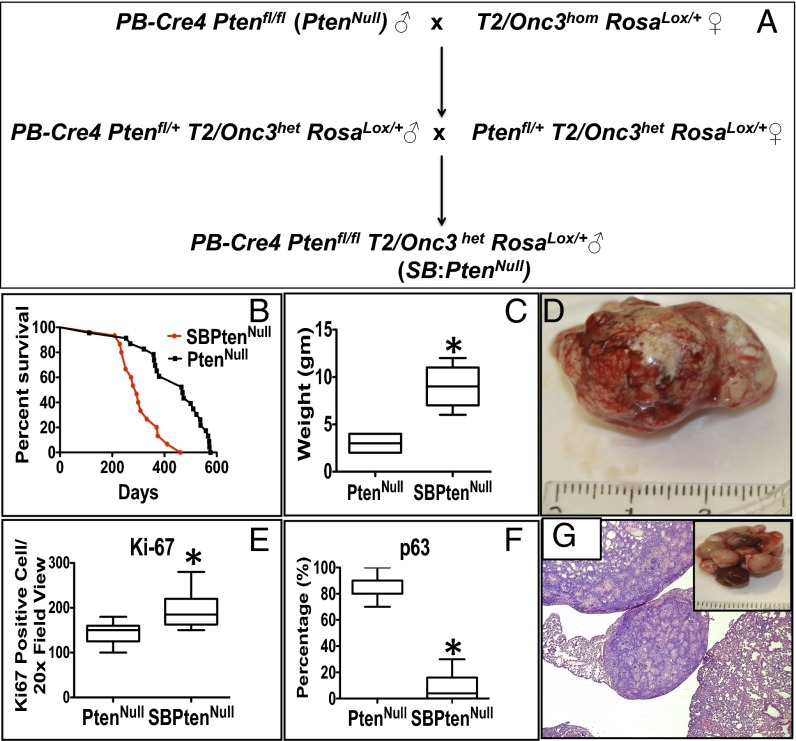
Identification of novel genes from a SB transposon screen on a background of PtenNull-driven prostate cancer. (A) Breeding schedule to generate SB:PtenNull (PB-Cre4:Ptenfl/flT2Onc3het Rosa26Lox66SBLox71/+). (B) Kaplan–Meier (log-rank) curve demonstrating reduced survival in the SB:PtenNull cohort, compared with the PtenNull mice (n = 21 vs. 21, P < 0.0001). (C) Boxplot comparing the weight of primary prostate tumors (n = 21 vs. 21, *P = 0.002; Mann–Whitney). (D) Prostate tumor from SB:PtenNull mice. (E) Boxplot comparing Ki-67 staining between the cohorts (n = 21 vs. 21, *P < 0.0001; Mann–Whitney). (F) Comparison of p63 IHC between the cohorts (y axis represents percentage of glandular basement left intact; n = 21 vs. 21 *P < 0.0001; Mann–Whitney). (G) Representative lung metastasis from SB:PtenNull mouse.

