Fig. S4.
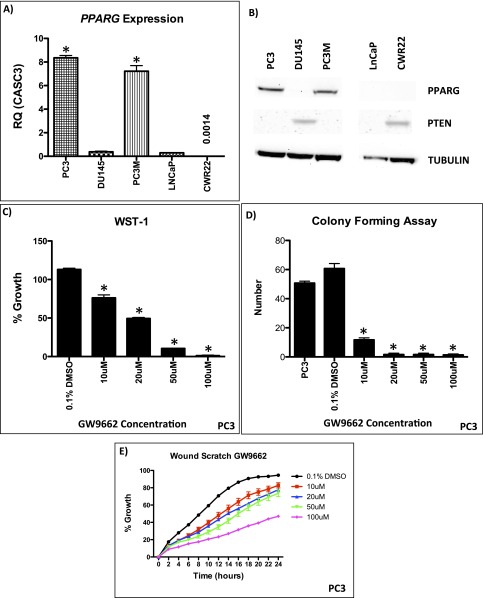
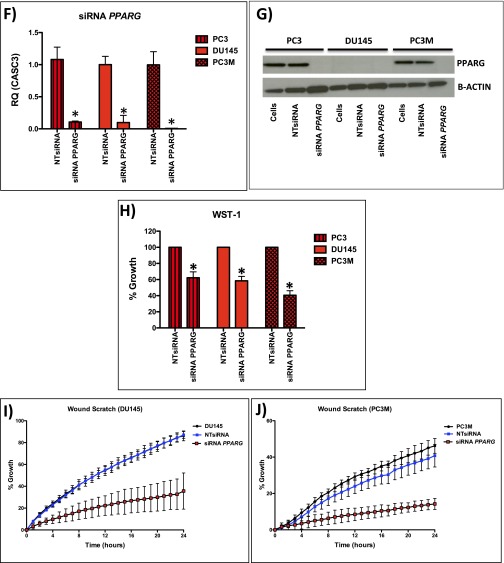
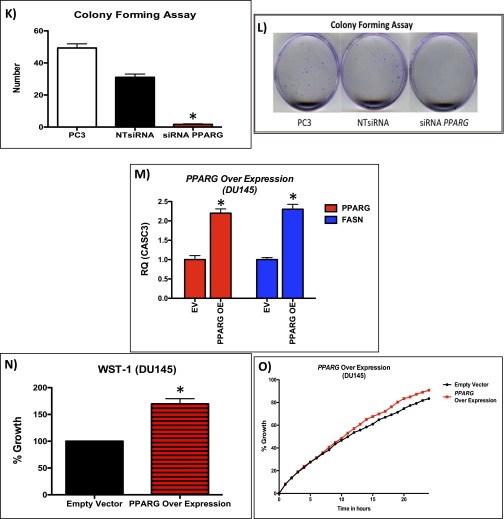
(A) RT-PCR of PPARG in human CaP cell lines (*P < 0.0001; Mann–Whitney). (B) Representative immunoblotting of PPARG in human CaP cell lines. (C–E) Functional analysis of GW9662 treated PC3 cells: (C) WST-1 (n = 3, error bars represent SEM, *P < 0.05; Mann–Whitney), (D) colony forming assay (n = 3, error bars represent SEM, *P < 0.0001; Mann–Whitney), and (E) wound scratch assay demonstrate statistically significant reductions at GW9662 doses of 10 μM and upward (n = 3, error bars represent SD, P < 0.001; ANOVA). (F) mRNA levels of PPARG in siRNA mediated knockdown in PC3, PC3M, and DU145 cells (n = 3, error bars represent SEM, *P < 0.001; Mann–Whitney). (G) Immunoblotting of PPARG in PC3, PC3M, and DU145 cells demonstrating reduction of protein expression following siRNA knockdown of PPARG. Following siRNA-mediated knockdown of PPARG expression (controlled with NTsiRNA), PC3, PC3M, and DU145 cells were functionally assessed using (H) WST-1 proliferation assay, demonstrating reduced growth (n = 3, error bars represent SEM, *P < 0.01; Mann–Whitney); (I and J) wound scratch assay, demonstrating reduced migration (n = 3, error bars represent SD, P < 0.001; ANOVA); and (K and L) colony forming assay, demonstrating a reduction in number of colonies (n = 3, error bars represent SEM, *P < 0.0001; Mann–Whitney). (M) Overexpression of PPARG in DU145 cells demonstrates up-regulation of PPARG and FASN at the mRNA level (n = 3, error bars represent SEM, *P < 0.001; Mann–Whitney). (N) WST-1 proliferation assay, demonstrating increased growth (n = 3, error bars represent SEM, *P < 0.001; Mann–Whitney) and (O) wound scratch assay, demonstrating increased migration (n = 3, error bars represent SD, P < 0.01; ANOVA) following PPARG overexpression in DU145 cells compared with empty vector control (n = 3 repeated experiments for each of the panels, each tested in triplicate).


