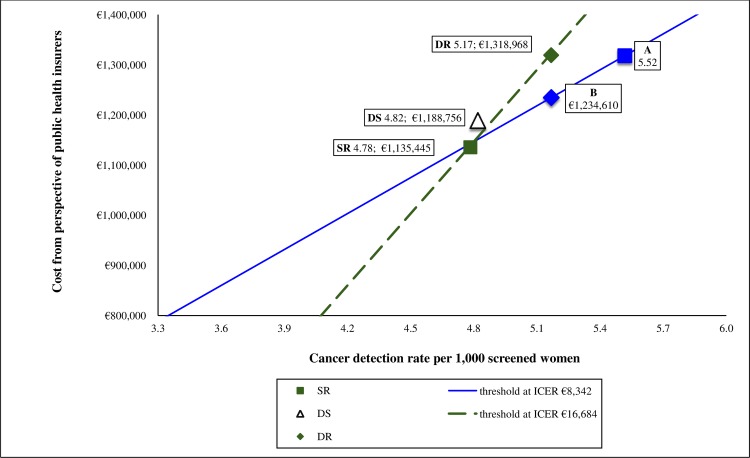
Fig 3. Cost-effectiveness plane illustrating differences in costs and cancer detection rates between the reading strategies.
DR = Double reading. SR = Single reading. DS = Double reading in prevalent screening and single reading in incident screening. Continuous and dashed lines represent the thresholds if willingness to pay per one additionally detected cancer were €8,342 and €16,684, respectively. Point A represents the expected cancer detection rate at single reading if willingness to pay per single reading were equal to double reading. Point B represents the expected cost at single reading if the cancer detection rate at single reading were equal to that of double reading.

